Colorado Springs Market Information
September 2026 – Pikes Peak Region
AVERAGE SALE PRICE
$545,660
▼ 3.5% YoY
MEDIAN SALE PRICE
$479,000
▼ 0.1% YoY
CLOSED SALES
926
▼ 9.7% YoY
ACTIVE LISTINGS
4,253
▲ 6.1% YoY
DAYS ON MARKET
53
▼ 1.9% YoY
MONTHS SUPPLY
4.6
▲ 17.9% YoY
Single Family & Patio Homes Market Analysis
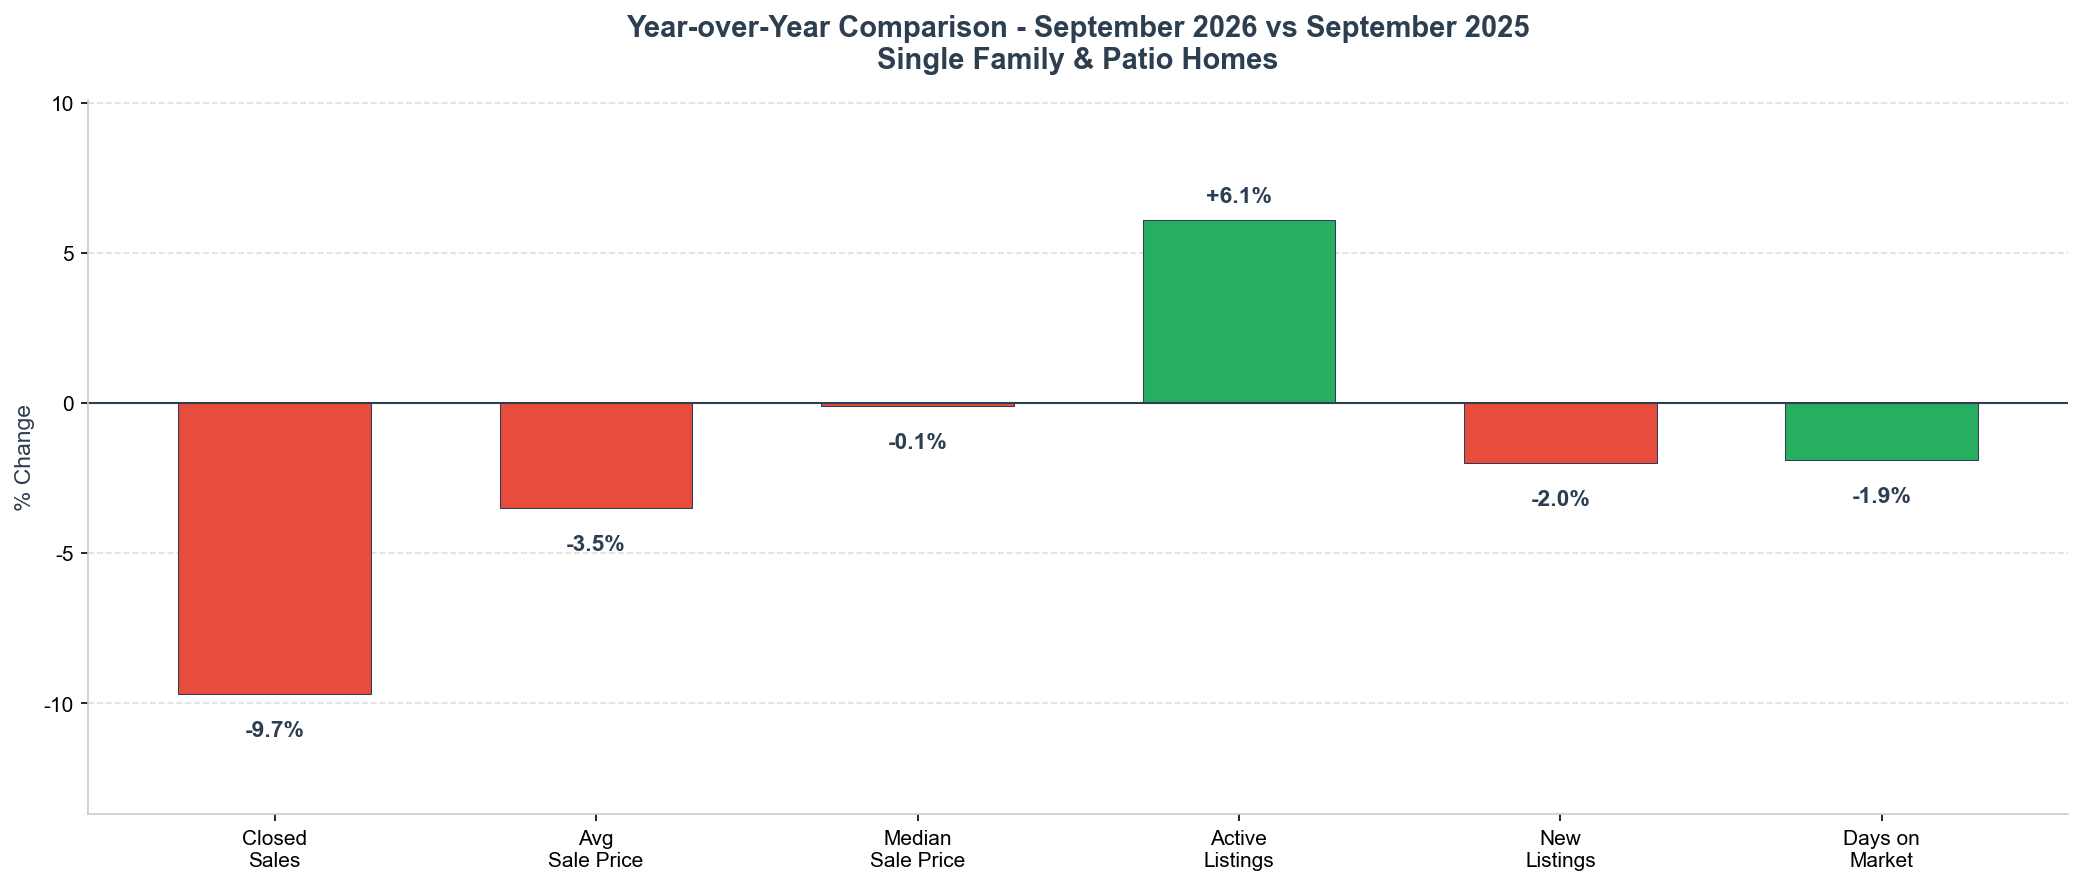
Current Market Conditions: September was quieter than August, which is what September always does. 926 homes closed in the Pikes Peak Region, down 7% from August. Over the last ten years September has averaged about 8% fewer sales than August, so the monthly drop is right on schedule. The year-over-year number is the one to look at. Sales were down 9.7% from last September, and it was the fewest September closings since 2013. Meanwhile 4,253 homes were for sale, up 6.1% from a year ago and the most for any September since 2010. The average sale price came in at $545,660, down 3.5% from last year. The median held at $479,000, basically even with last September. Homes took 53 days to sell, about the same as last year, and months supply rose to 4.6 from 3.9. Year to date the region has 9,106 closings, less than 1% behind 2025, so the year as a whole is holding up. Buyers just have a lot more to choose from going into winter than they did a year ago.
Year-Over-Year Market Changes
Average and Median Price Trend
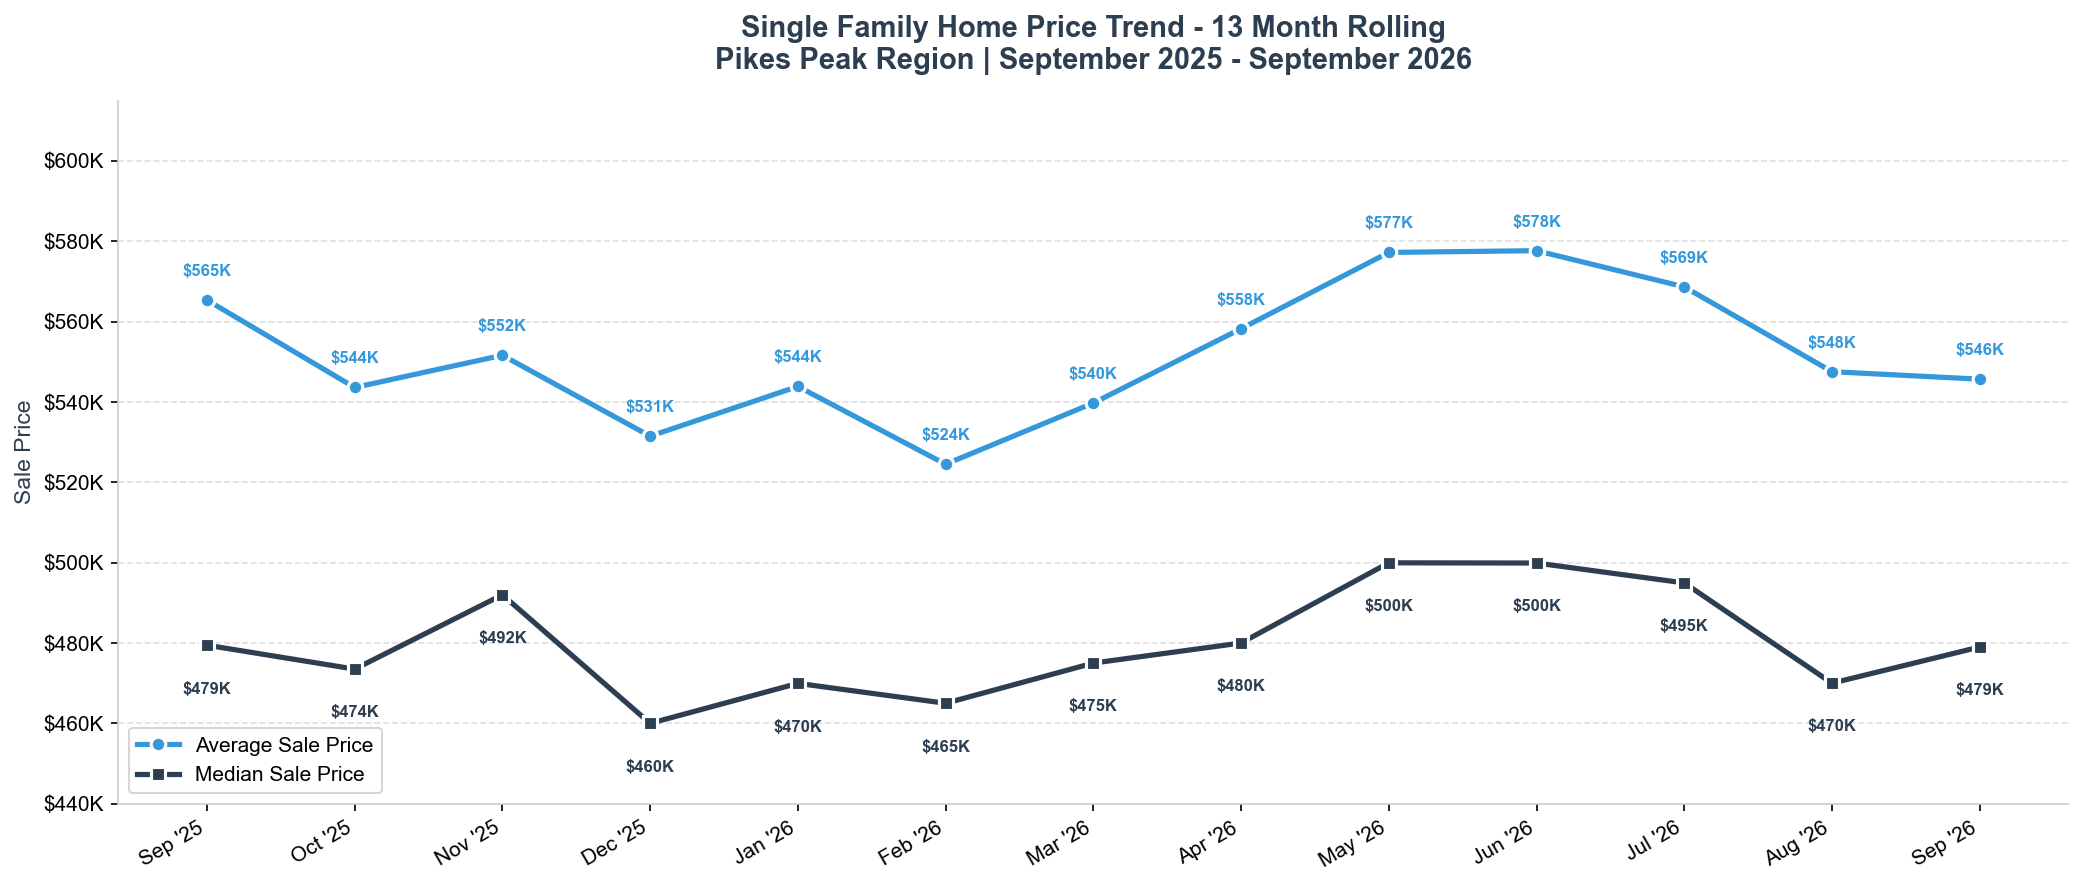
Price Trend Analysis: After two months of dropping, the average price mostly stopped moving. It went from $547,521 in August to $545,660 in September, a difference of less than $2,000. That still leaves it about $32,000 under the June peak of $577,638. The median actually ticked up, from $470,000 to $479,000. Over the full 13 months you can see the normal pattern: low in the winter, a spring climb, a summer peak, then a slide into fall. This year’s peak came in lower than last year’s and the slide started a little earlier. Last September the average was $565,356, so we are running about $20,000 behind on the same month. In El Paso County alone the average was $554,263, down 2.4% from last year, and the median was $482,400, up half a percent. Prices are not falling apart. They gave back the summer gains and leveled off.
Inventory Trend – Homes For Sale
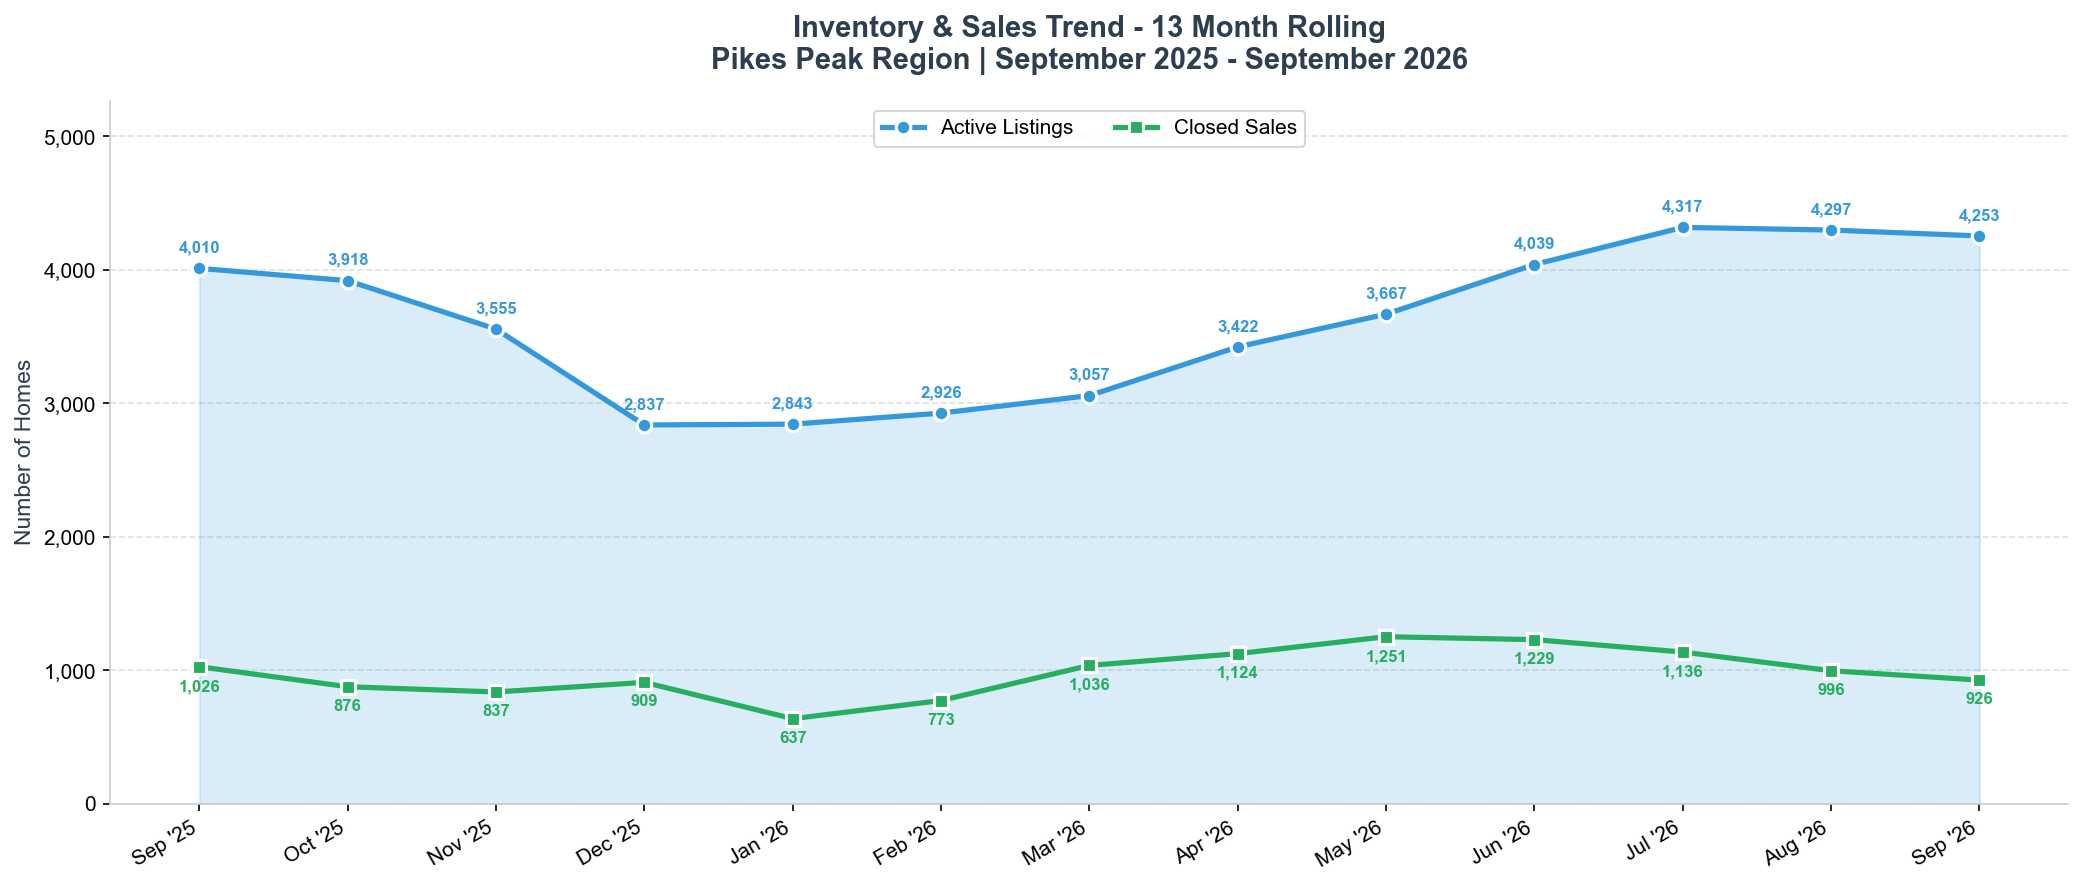
Inventory Analysis: Active listings slipped to 4,253 from 4,297 in August. That’s the second month in a row of a small decline, and it usually keeps going through the winter as sellers pull their homes off the market. But we are starting the fall slide from a much higher spot than usual. Last September there were 4,010 homes for sale, and the year before that 3,392. New listings were 1,302, down 2% from last year, so this is not a wave of new sellers. It’s homes that aren’t selling and are staying on the market longer. Almost half of the active single family listings in El Paso County, 1,487 of 3,204, have already had at least one price reduction. Homes under contract at the end of September came in at 1,277, down about 8% from 1,386 a year ago, so October closings will probably stay on the lighter side. Months supply is now 4.6. A balanced market usually runs five to six months, and we are getting close.
Absorption Rate by Price Range
The absorption rate compares how many homes sold to how many are on the market. This month’s report is based on 60 days of sales, not the usual 30, so the percentages run about twice as high as last month’s chart. On a 60-day basis, roughly 40% and above points to a seller’s market and below 30% points to a buyer’s market.
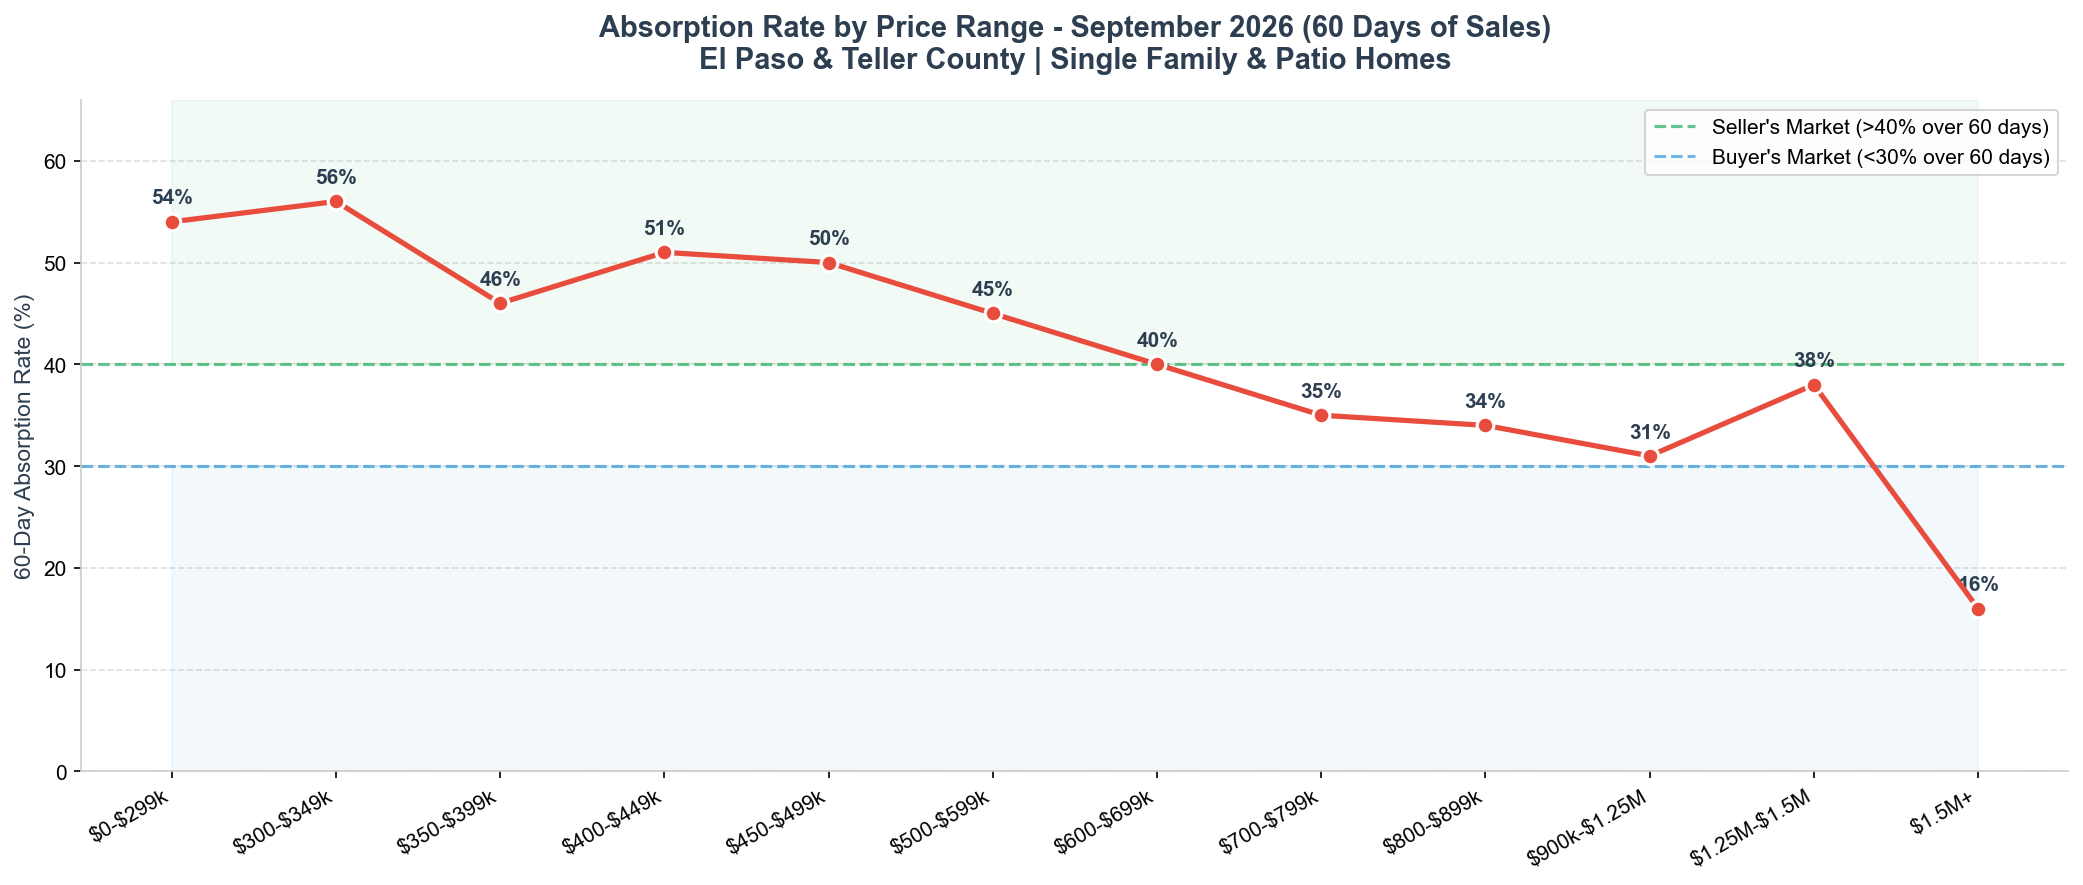
Price Range Analysis: The split is the same one we’ve seen all fall, it just shows up differently on the 60-day numbers. Everything under $600K is still moving like a seller’s market. The $300K-$350K range is the strongest at 56%, under $300K is at 54%, and $400K-$500K sits right around 50%. The $600K-$700K band is right on the line at 40%. From $700K to $1.25M it drops into the low to mid 30s, which is balanced territory where good homes sell and overpriced ones sit. $1.25M-$1.5M had a decent couple of months at 38%. Then $1.5M and up falls to 16%, solidly a buyer’s market. If you’re under $600K and priced right, you can still expect real activity. If you’re over $1.5M, plan on a long runway.
Days Supply by Price Range – Single Family Homes
Days supply tells you how long it would take to sell everything currently on the market at the current pace of sales. Lower numbers mean a faster market. This report covers July 1 through September 30, 2026.
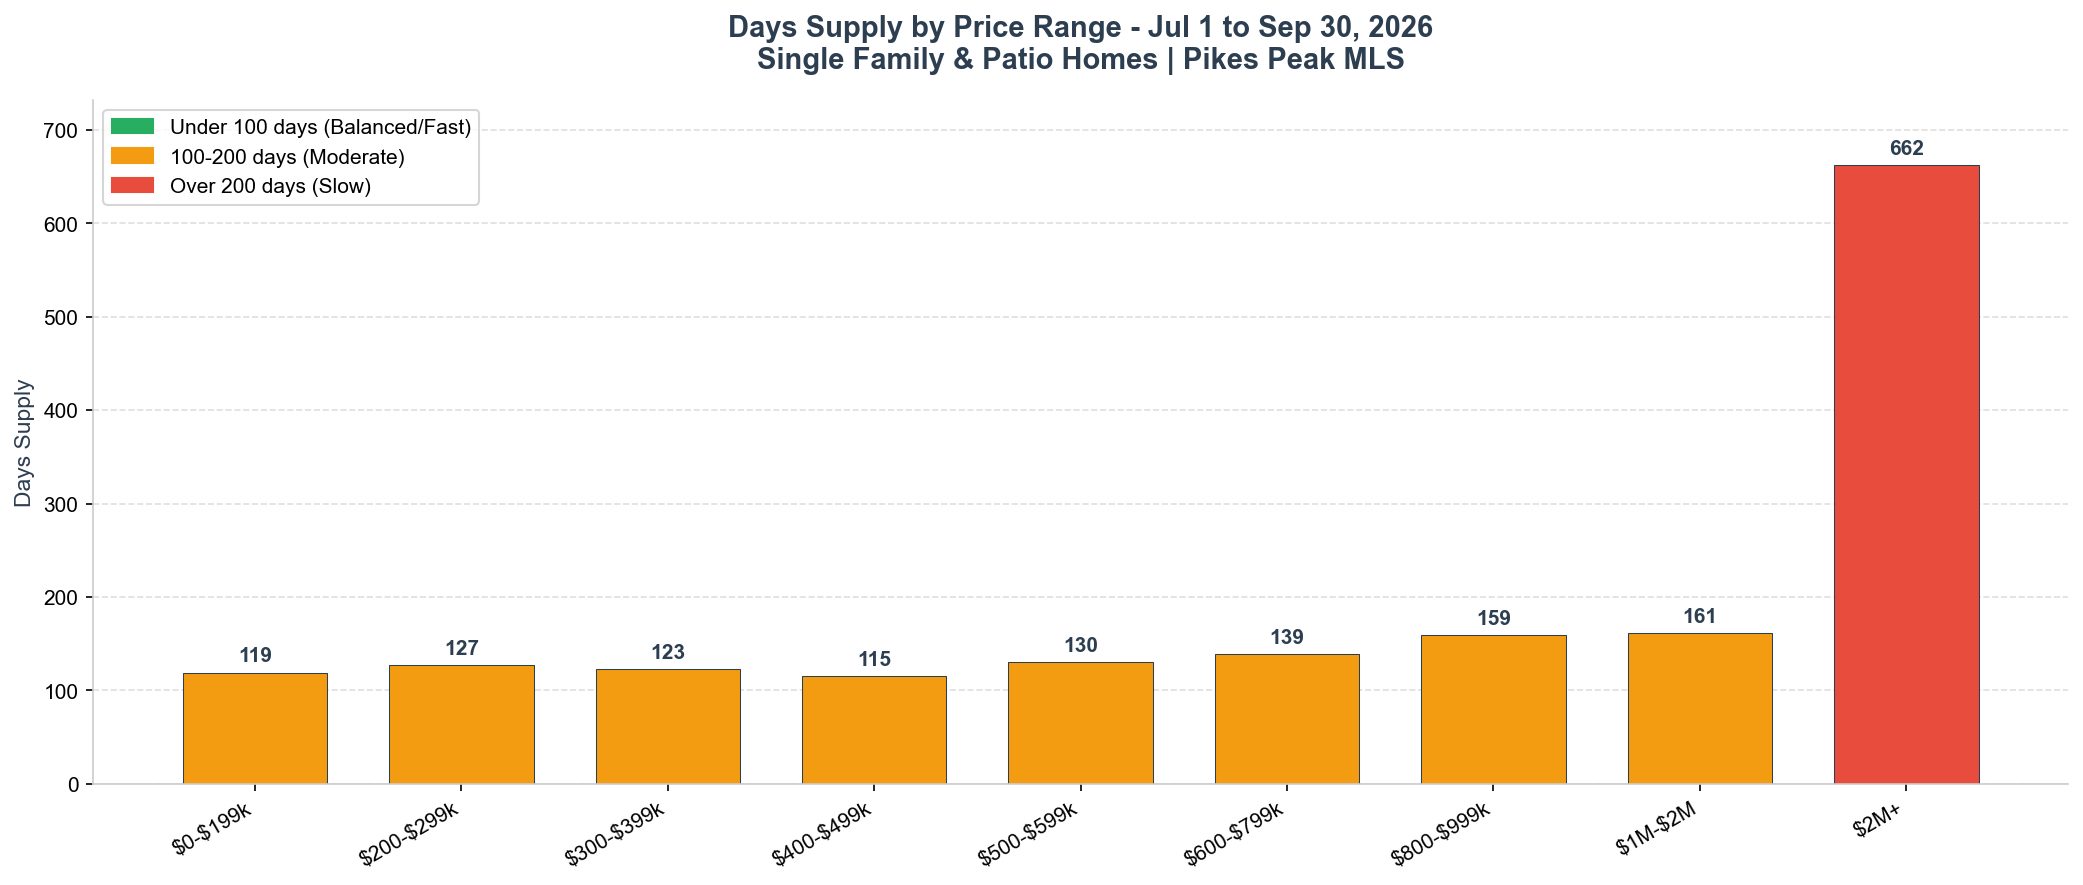
Days Supply Analysis: Every price range went up again compared to the June through August report. The $400K-$500K range is now the fastest at 115 days, up from 108. The $300K-$400K range took the biggest jump in the lower half of the market, going from 106 to 123 days. Under $200K is at 119 days, $200K-$300K at 127, $500K-$600K at 130, and $600K-$800K at 139. The $800K-$1M and $1M-$2M ranges are both around 160 days. Over $2M it’s 662 days, up from 542. There were 108 homes listed above $2 million and only 15 sold in three months. Everywhere under $2M is still in the 100 to 200 day range, which is moderate. It just takes longer to sell than it did this summer, and it’s taking a little longer every month.
Sale Price vs. Asking Price
This breaks down how closed sales finished relative to the seller’s asking price, by price range. Most homes close with some negotiation – the chart shows exactly where buyers have the most and least leverage.
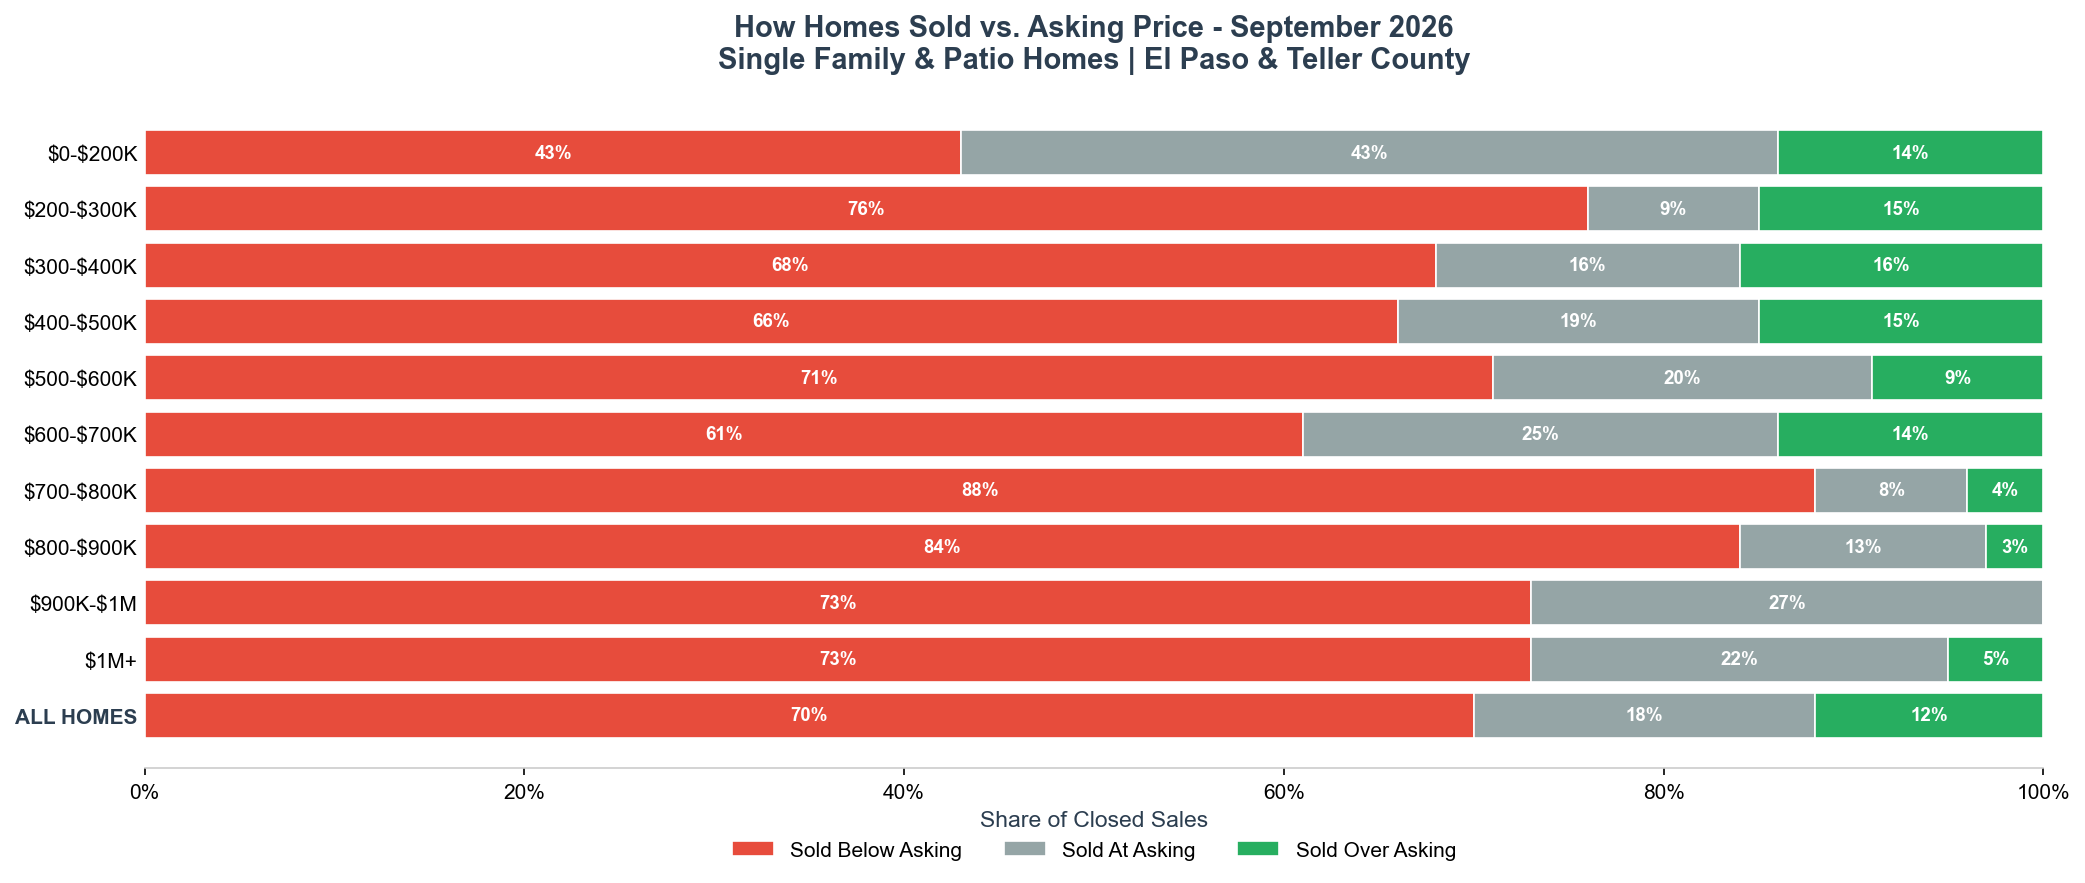
Negotiation Power: Of the 767 single family and patio homes in El Paso and Teller counties tracked in this report, 70% sold below asking, 18% sold right at asking, and only 12% went over. In August it was 66% below and 15% over. Part of that is just the time of year. The share of homes selling under asking usually goes up in the fall and peaks in the winter. Last December it was 75%, and by May it was down to 56%. Most of these sales still close pretty close to list price, so this is mostly sellers who priced a little high and then met buyers partway. It’s not homes selling at deep discounts. The $300K-$400K range was the most competitive, with 16% going over asking. The $700K-$900K range was where buyers had the most leverage. 88% of the $700K-$800K sales and 84% of the $800K-$900K sales closed under list. None of the 11 homes that sold between $900K and $1M went over asking.
Market Outlook – Fall 2026
On the Ground: Showings cooled off through September, from around 3,400 a week at the start of the month to 3,027 the week of September 28. The week of October 5 through 11 ticked back up a little to 3,126 showings on about 4,720 listings across El Paso and Teller counties. About half of that traffic, 1,610 showings, was on homes between $300,000 and $500,000, so that’s still where most buyers are shopping. New listings slowed down to 233 for the week, and 55 homes came back on the market. Here’s what I’m seeing: the homes that sell are clean, priced to what sold in the last 30 days, and usually go under contract in the first couple of weeks. The ones priced off spring sales sit, get a price cut, and sit some more. With pending sales down 8% from last year, October will likely be slow too. Sellers who list now will be competing with more homes than they would have in years, and buyers who are ready now get the benefit of that.
For Buyers
- 4,253 homes to choose from, the most in a September since 2010
- 70% of September sales closed below asking, and only 12% went over
- Almost half the homes for sale in El Paso County have already cut their price
- The $700K-$900K range has the most room to negotiate, with more than 8 out of 10 selling under list
- Asking for closing costs or a rate buydown is normal right now
- Over $1.5M you’re in a true buyer’s market
For Sellers
- The median held at $479,000, the same as last September
- Under $600K still sells like a seller’s market when the price is right
- $400K-$500K is the fastest range at 115 days of supply
- Price to what closed in the last 30 days, not what your neighbor got in May
- The first two weeks matter most. Homes that miss early end up with price cuts
- Expect to negotiate. Only 12% of homes sold over asking
Condos & Townhomes Market
AVERAGE PRICE
$329,150
▼ 10.1% YoY
MEDIAN PRICE
$297,000
▼ 8.9% YoY
CLOSED SALES
119
▼ 16.8% YoY
DAYS ON MARKET
59
▼ 13.2% YoY
Condo Market Highlights: Condos and townhomes are still the softest part of the market. 119 closed in September, down 16.8% from last year. The average price dropped 10.1% to $329,150 and the median fell 8.9% to $297,000. Unlike August, this time the median dropped along with the average, so it’s not just fewer high-end units closing. Prices on typical condos are coming down too. There are 716 condos and townhomes for sale, up 10.5% from a year ago, and new listings were up 10% as well. Months supply is at 6.0, compared to 4.5 last September. Six months is where buyers start to have the edge, and it’s well above the 4.6 months on the single family side. Units are averaging 59 days to sell, which is actually faster than last September’s 68, so the ones priced right are still moving. If you’re selling a condo, price it against what closed in the last 60 days and plan on helping with closing costs or HOA dues. If you’re buying, this is where your money goes the furthest right now.
Data Source: Pikes Peak REALTOR Services Corp. (RSC) | September 2026
Market data for residential properties in El Paso County and Teller County, Colorado.
**Information gathered from the Pikes Peak MLS is deemed reliable but not guaranteed