
Colorado Springs Market Information
June 2026 – Pikes Peak Region
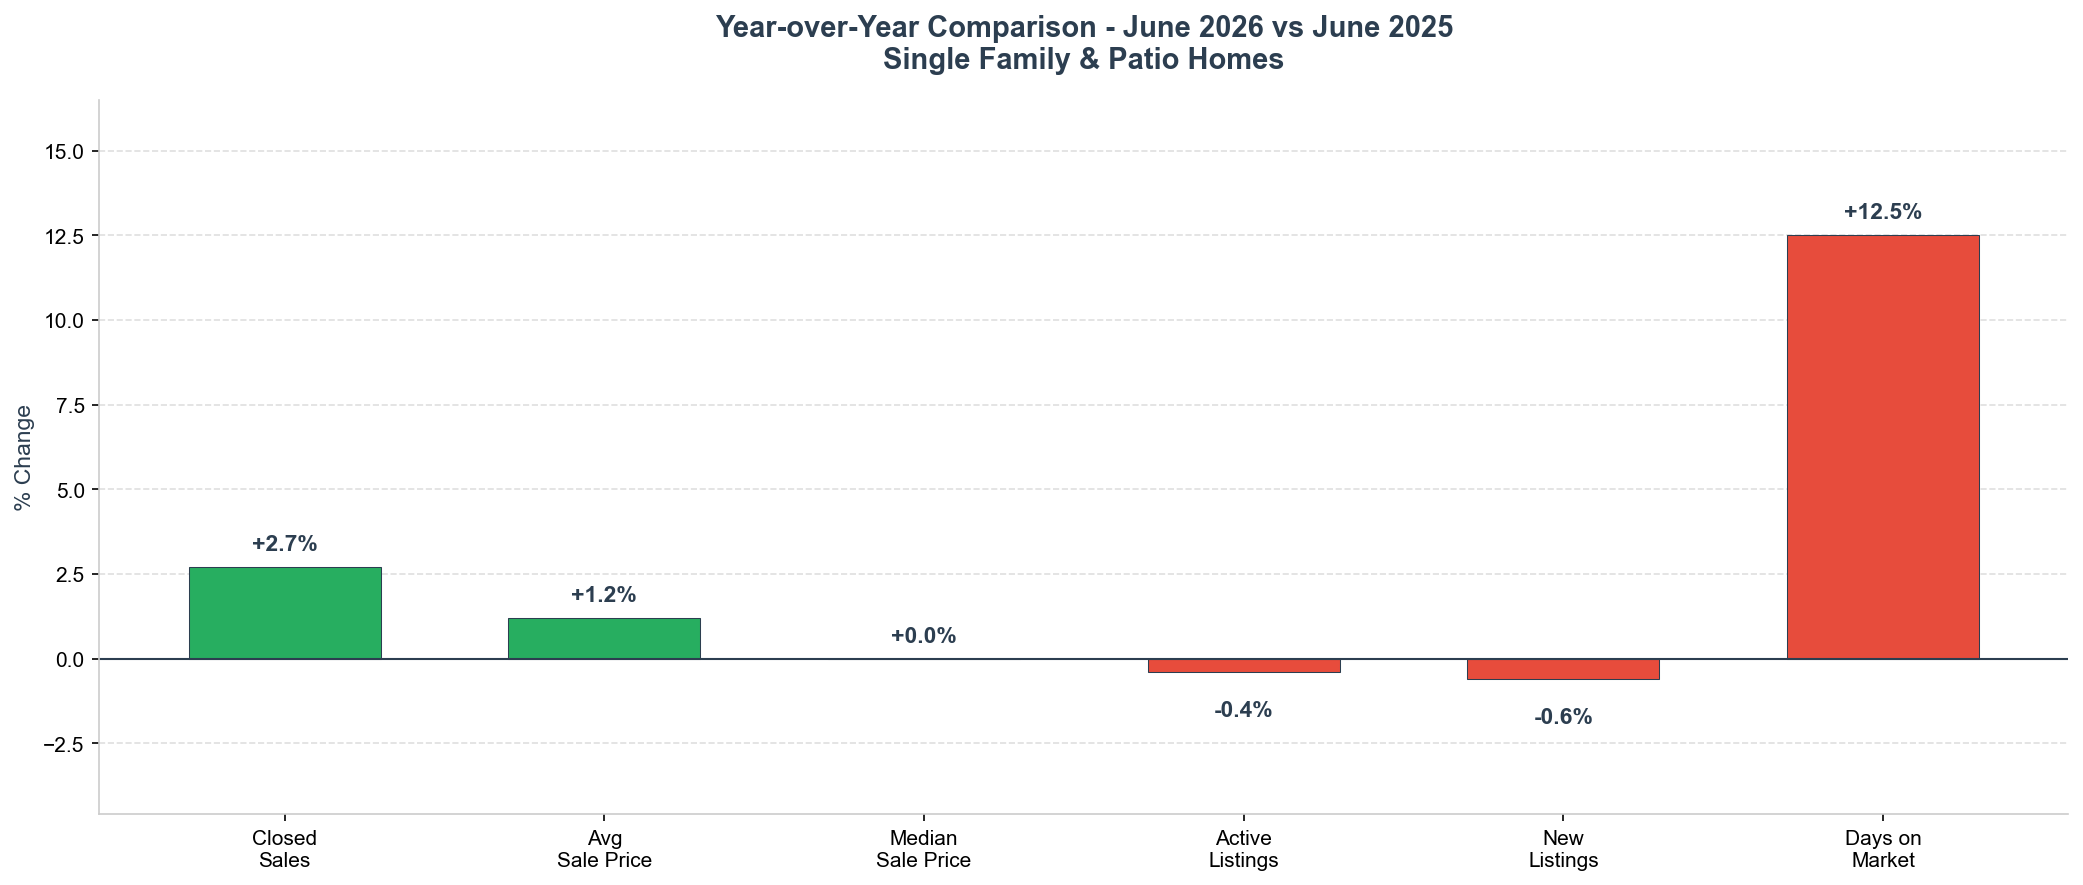
AVERAGE SALE PRICE
$577,638
▲ 1.2% YoY
MEDIAN SALE PRICE
$499,900
▬ 0.0% YoY
CLOSED SALES
1,229
▲ 2.7% YoY
DAYS ON MARKET
45
▲ 12.5% YoY
MONTHS SUPPLY
3.3
▼ 2.9% YoY
Single Family & Patio Homes Market Analysis
Current Market Conditions: June kept the Pikes Peak market in high gear. The average sale price edged up to $577,638 – a new 13-month high and the second straight month setting a record, just past May’s $577,202. The median held right at $499,900, essentially the half-million mark and dead even with last June. Closed sales came in at 1,229, up 2.7% from a year ago and the second-strongest month in the past year, and year-to-date sales reached 6,048, running ahead of last June’s 5,954. The bigger shift this month was inventory: active listings climbed to 4,039, back above 4,000 for the first time in a full year, so buyers finally have more to choose from. New listings held steady at 1,858 (down just 0.6% year-over-year), a much healthier supply picture than the double-digit drop we saw in spring. Homes took a little longer to sell – 45 days on market, up from 43 in May – but with months supply at 3.3, the core of the market is still firmly seller-leaning heading through summer.
Year-Over-Year Market Changes
Average and Median Price Trend
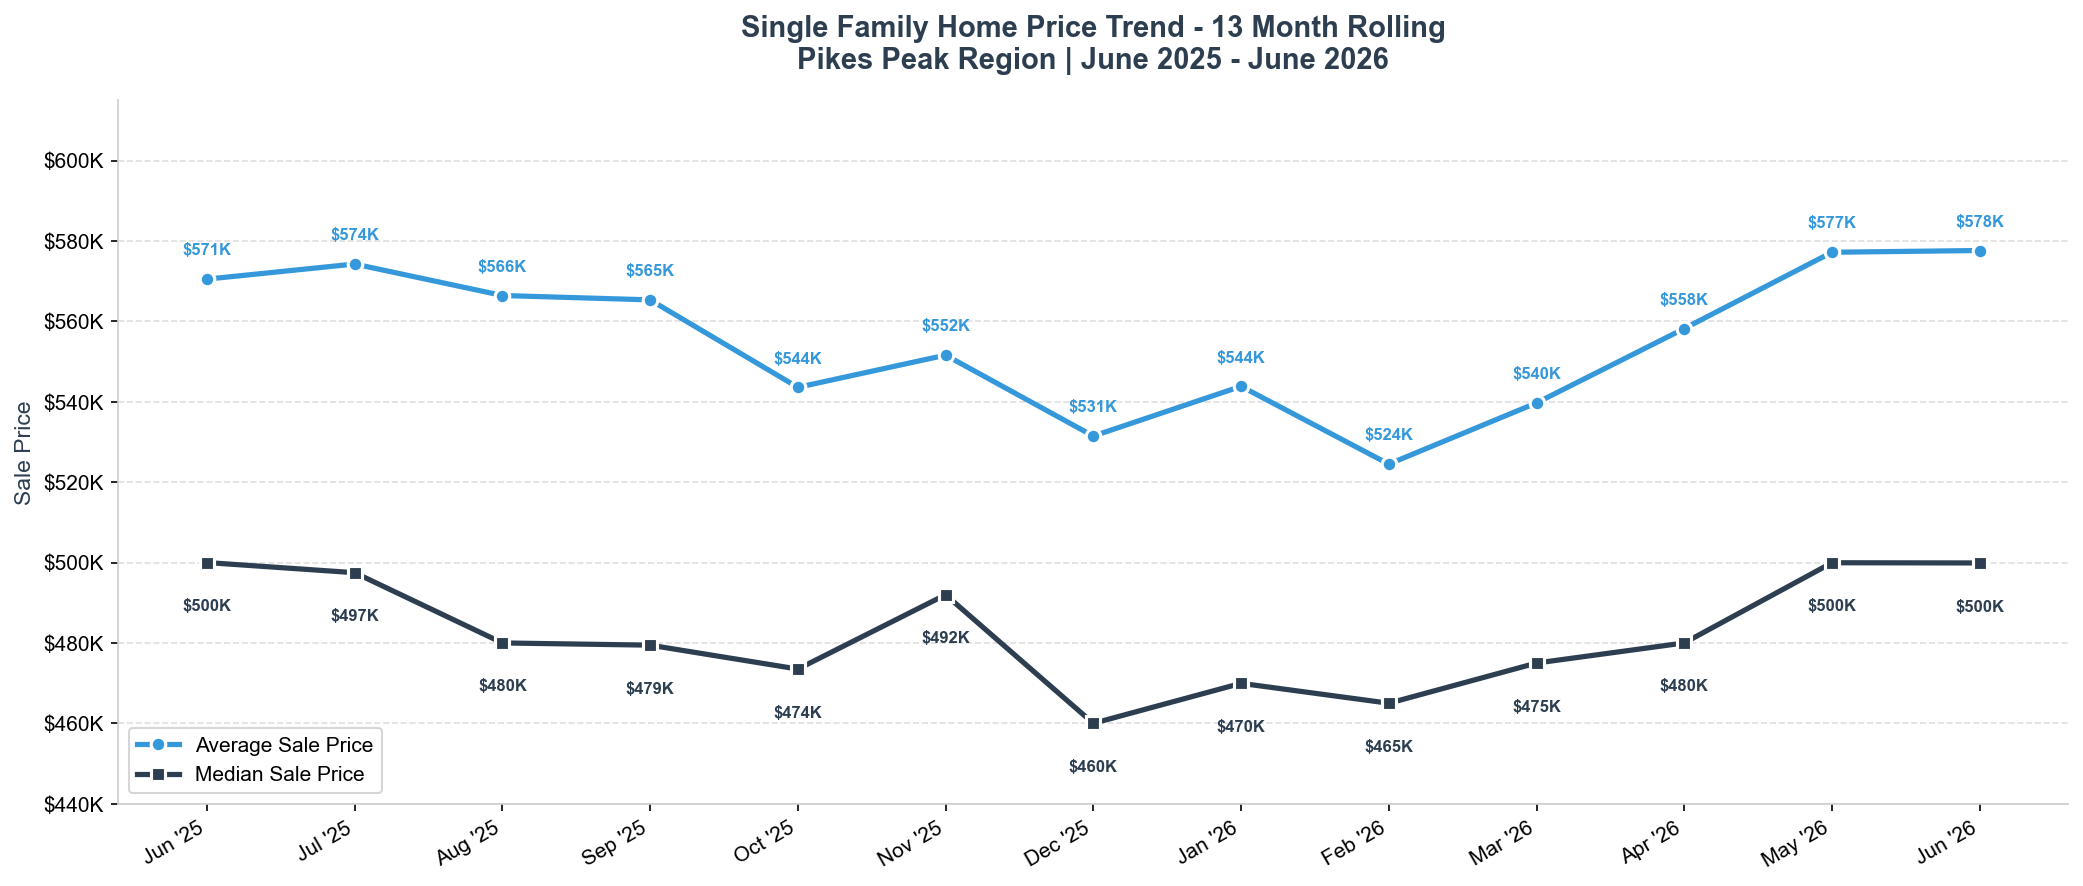
Price Trend Analysis: Prices have now climbed for four straight months, and June set a fresh high. The average has run from a February low of $524,494 up to $577,638 – a 10% rebound and the top reading in the entire 13-month window, even above last summer’s $574,276 peak. The median has done the same, holding just under $500,000 for a second month after bottoming at $460,000 in December. The winter dip is fully in the rearview. What is notable now is that prices are holding at record levels even as more homes come to market, which points to steady buyer demand rather than a supply squeeze. For sellers, this remains the strongest pricing window of the year; for buyers, values have stopped falling and the discounts from this winter are gone.
Inventory Trend – Homes For Sale
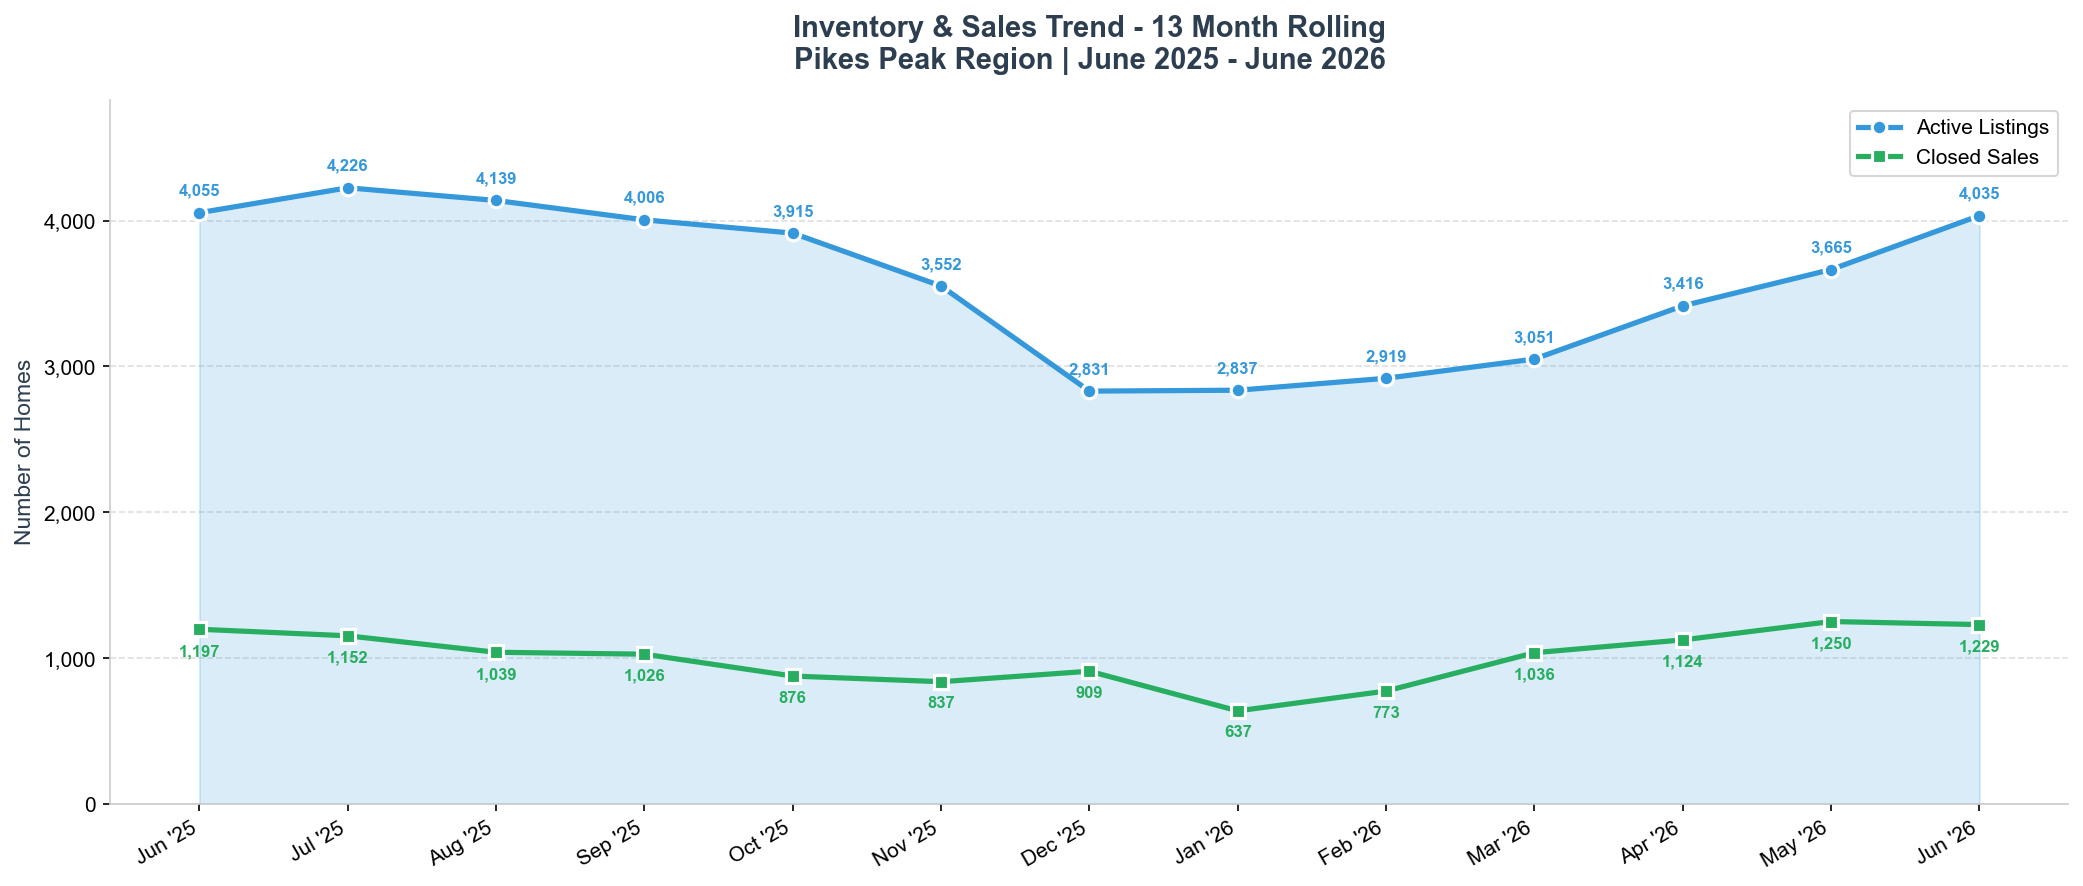
Inventory Analysis: Active inventory reached 4,039 homes in June, up from 3,665 in May and back over the 4,000 line for the first time since last summer. That is the most choice buyers have had in a year, though it is still essentially flat versus last June (down 0.4%). The supply side is normalizing too: new listings came in at 1,858, down only 0.6% from a year ago, a big change from the thin spring pipeline. Closed sales of 1,229 stayed strong, and the combination of steady demand and a rebuilding inventory pulled months supply to 3.3. Inventory typically peaks in July, so there is likely one more month of added selection ahead – good news for buyers who have been waiting – while the core price ranges still favor sellers.
Absorption Rate by Price Range
The absorption rate measures how quickly homes are selling. Rates above 20% indicate a seller’s market, while rates below 15% suggest a buyer’s market.
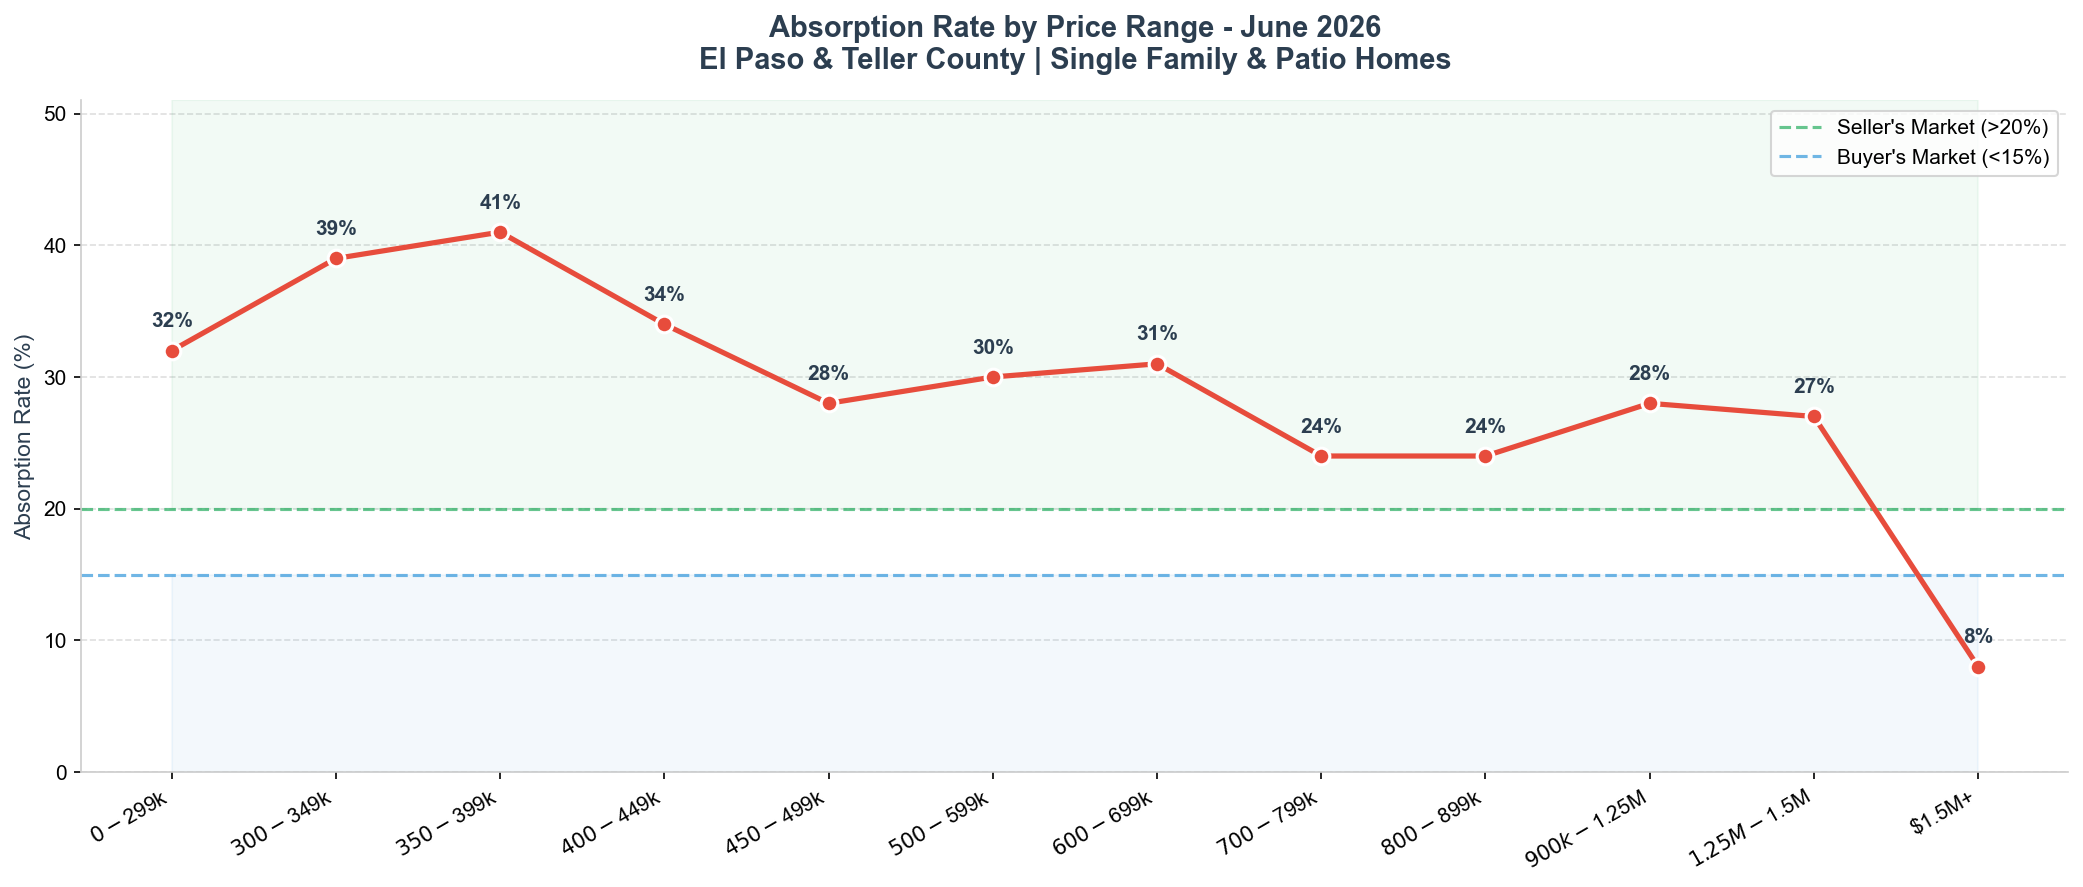
Price Range Analysis: The middle of the market is where the action is. Absorption peaks at 41% in the $350K-$400K band and runs 32-39% from the entry level through $450K – solidly a seller’s market. The $500K-$700K range stays healthy at 30-31%, and even the $900K-$1.5M segment holds 27-28%, above the 20% seller’s threshold. In fact nearly every price band this month sits in seller’s territory. The one real exception is the very top: homes at $1.5M and up absorbed at just 8%, a clear buyer’s market where high-end shoppers have the most room to negotiate. Bottom line – almost everywhere under $1.5M still favors sellers, with the deepest competition in the $300K-$450K sweet spot.
Days Supply by Price Range – Single Family Homes
Days supply indicates how long it would take to sell all current inventory at the current sales pace. Lower numbers indicate faster-moving markets.
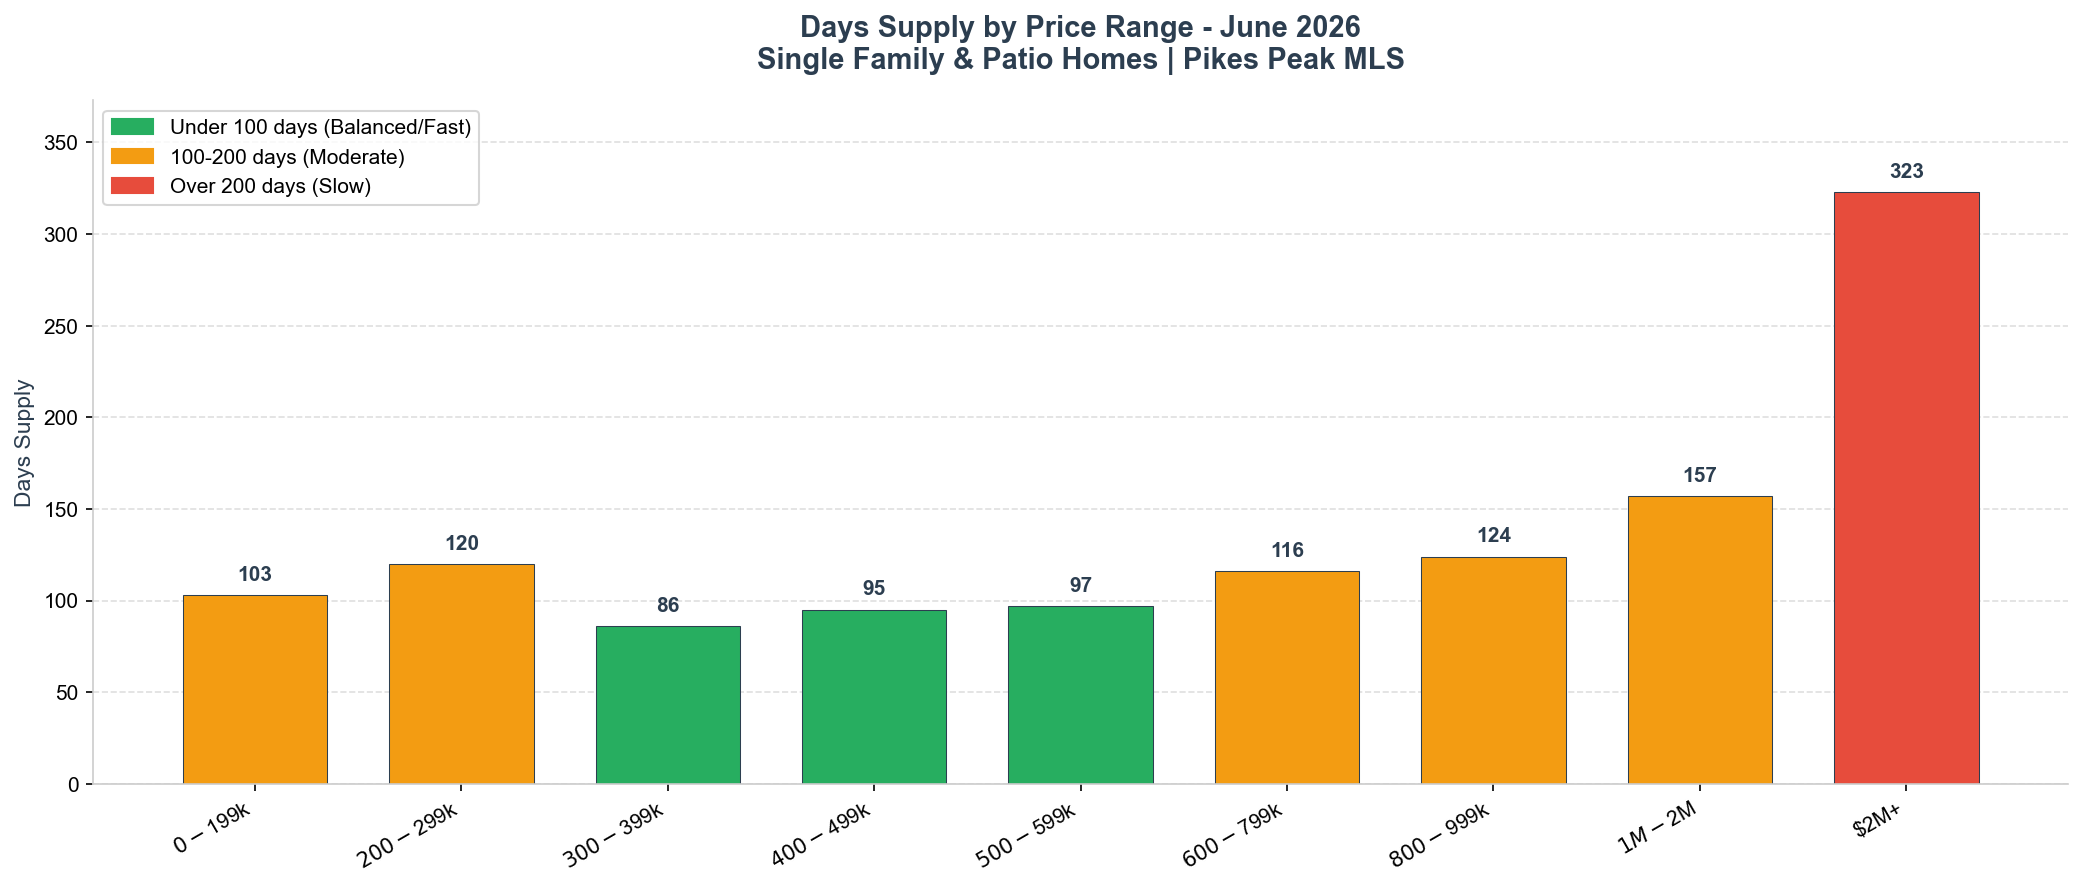
Inventory Analysis: The $300K-$400K range moves fastest at just 86 days of supply – the sweet spot where buyer demand is deepest. The $400K-$500K segment runs 95 days and $500K-$600K sits at 97, both in healthy seller-leaning territory. Just above 100 days you find the entry level under $200K (103), the $200K-$300K band (120), and the $600K-$800K range (116). Supply builds from there: $800K-$1M is 124 days and $1M-$2M is 157. The $2M+ market carries 323 days of supply, giving luxury buyers real negotiating room. The pattern matches the absorption data – the lower and middle price points are tight and fast, while the very top favors buyers.
Sale Price vs. Asking Price
This breaks down how closed sales finished relative to the seller’s asking price, by price range. Even in a competitive market, most homes still close with some negotiation – the chart shows exactly where buyers have the most and least leverage.
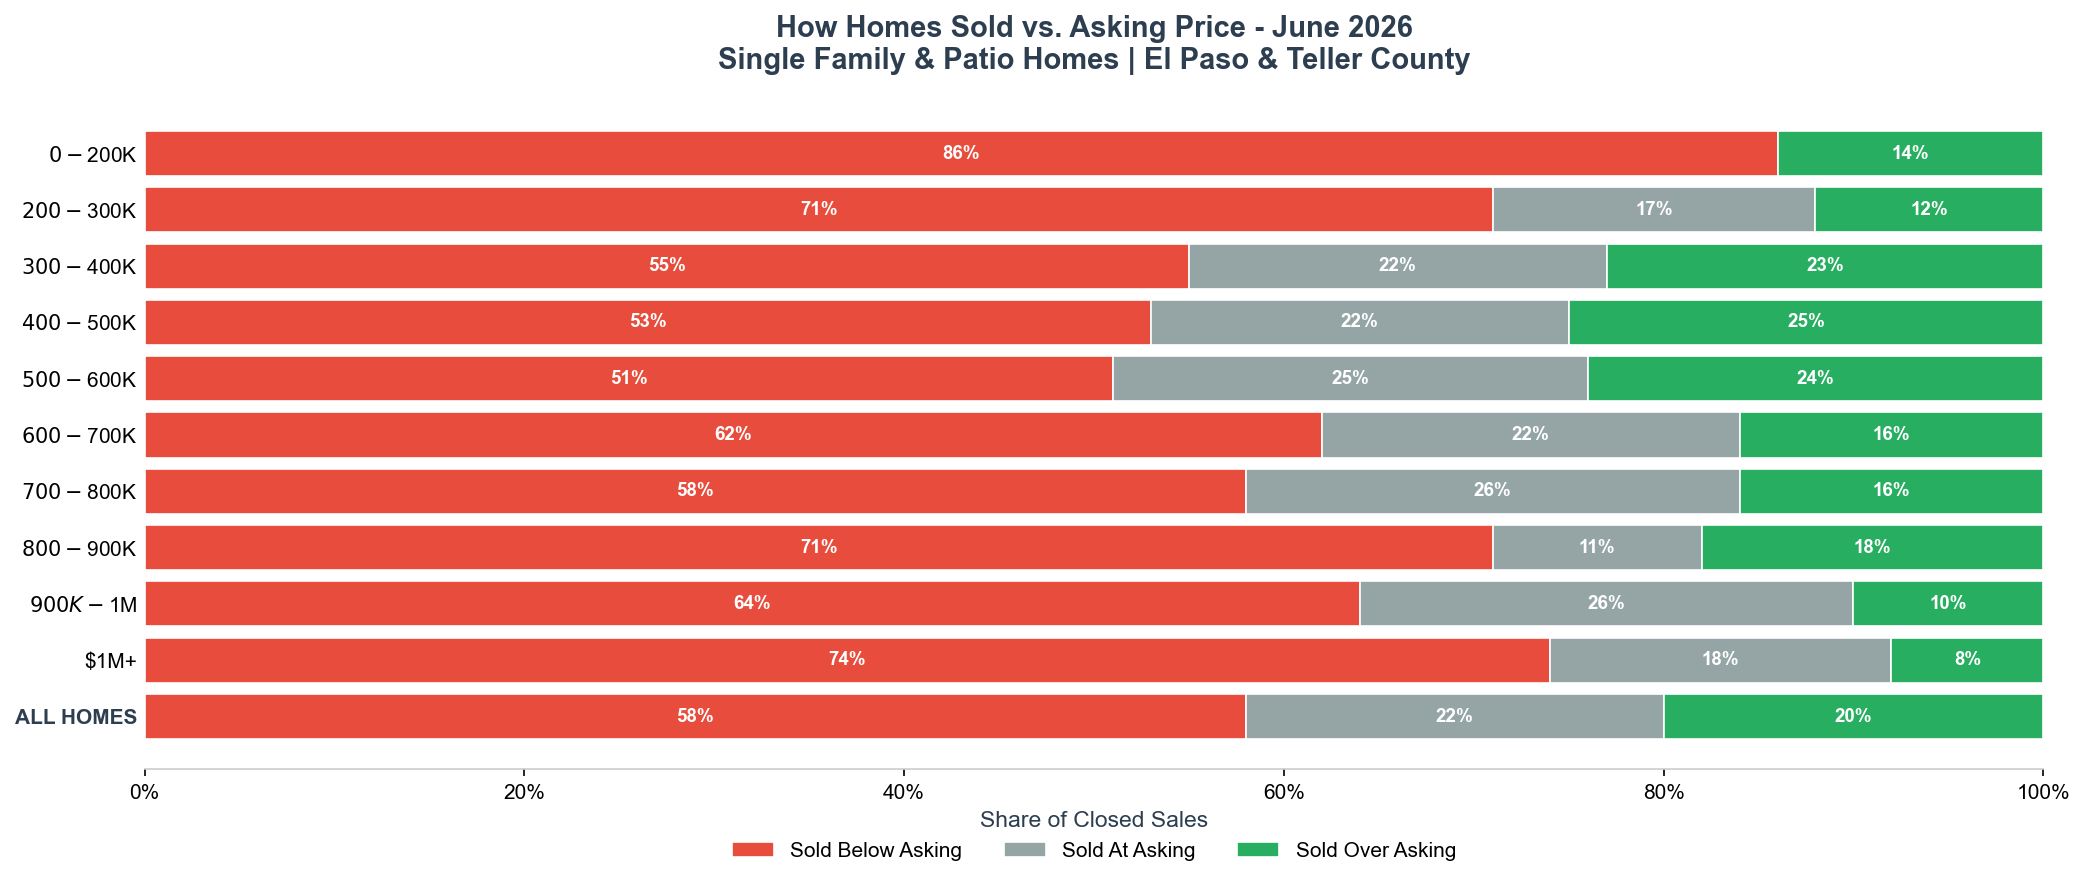
Negotiation Power: Across all 1,098 single family sales in June, 20% sold over asking, 22% sold right at asking, and 58% sold below. Keep in mind most below-asking sales close within a small margin of list price – it reflects realistic pricing more than deep discounts. The strongest seller leverage shows up in the core ranges: $400K-$500K led with 25% selling over asking, followed by $500K-$600K at 24% and $300K-$400K at 23%. Buyers have the most room at the top of the market – at $1M+, 74% of homes sold below asking and just 8% went over, and in the $900K-$1M band 64% sold under list. The practical read: price it right between $300K and $600K and you can still draw competing offers, but above $900K, expect buyers to negotiate.
Market Outlook – Summer 2026
On the Ground: June gave both sides of the market something. Sellers got record prices – the average hit a 13-month high for the second month running – while buyers finally got more to look at, with inventory back over 4,000 for the first time in a year. New listings have normalized, so the market feels less starved for supply than it did this spring. Well-priced homes in the $300K-$600K range are still seeing quick action and multiple offers, while anything above $900K, and especially over $1M, is slower and gives buyers leverage. With inventory usually peaking in July, buyers who have been on the sidelines have a real window right now, and sellers who prepare and price correctly are still in a strong position through the busiest stretch of the year.
For Buyers
- Inventory is back above 4,000 – the most choice you have had in a full year
- Selection usually peaks in July, so this is a strong window to be shopping
- 58% of homes sold below asking – there is room to negotiate, especially above $900K
- The $1M+ market has the most leverage (74% sold below asking, 323 days of supply)
- Prices are at a 13-month high – the winter discounts are gone, so act when you find the right home
- Get pre-approved before you shop – the $300K-$600K range still moves fast
For Sellers
- Average price set a 13-month high for the second month in a row ($577,638)
- The core market is still seller-leaning – months supply is just 3.3
- $300K-$600K homes are moving fastest (86-97 days of supply)
- More inventory is coming online, so pricing right from day one matters more now
- Homes are taking a touch longer – 45 days on market, up from 43 in May
- Above $900K, plan for longer marketing time and likely buyer concessions
Condos & Townhomes Market
AVERAGE PRICE
$349,354
▲ 0.4% YoY
MEDIAN PRICE
$325,000
▼ 1.5% YoY
CLOSED SALES
149
▲ 2.1% YoY
DAYS ON MARKET
53
▼ 8.6% YoY
Condo Market Highlights: The condo and townhome segment steadied in June. Closed sales came in at 149, up 2.1% from last June, and homes actually sold a bit faster – 53 days on market, down from 58 a year ago. Pricing was flat: the average edged up 0.4% to $349,354 while the median slipped 1.5% to $325,000. The story here is still inventory. Active condo listings jumped to 764, up 13.5% year-over-year, pushing months supply to 5.1 – up from 4.6 last June and well above the 3.3 on the single family side. That keeps this a more buyer-friendly segment: more choice and more negotiating room than the detached market. Condo and townhome sellers should price competitively from day one and plan for a slightly longer marketing window.
Data Source: Pikes Peak REALTOR Services Corp. (RSC) | June 2026
Market data for residential properties in El Paso County and Teller County, Colorado.
Market data for residential properties in El Paso County and Teller County, Colorado.
**Information gathered from the Pikes Peak MLS is deemed reliable but not guaranteed