
Colorado Springs Market Information
January 2026 – Pikes Peak Region
|
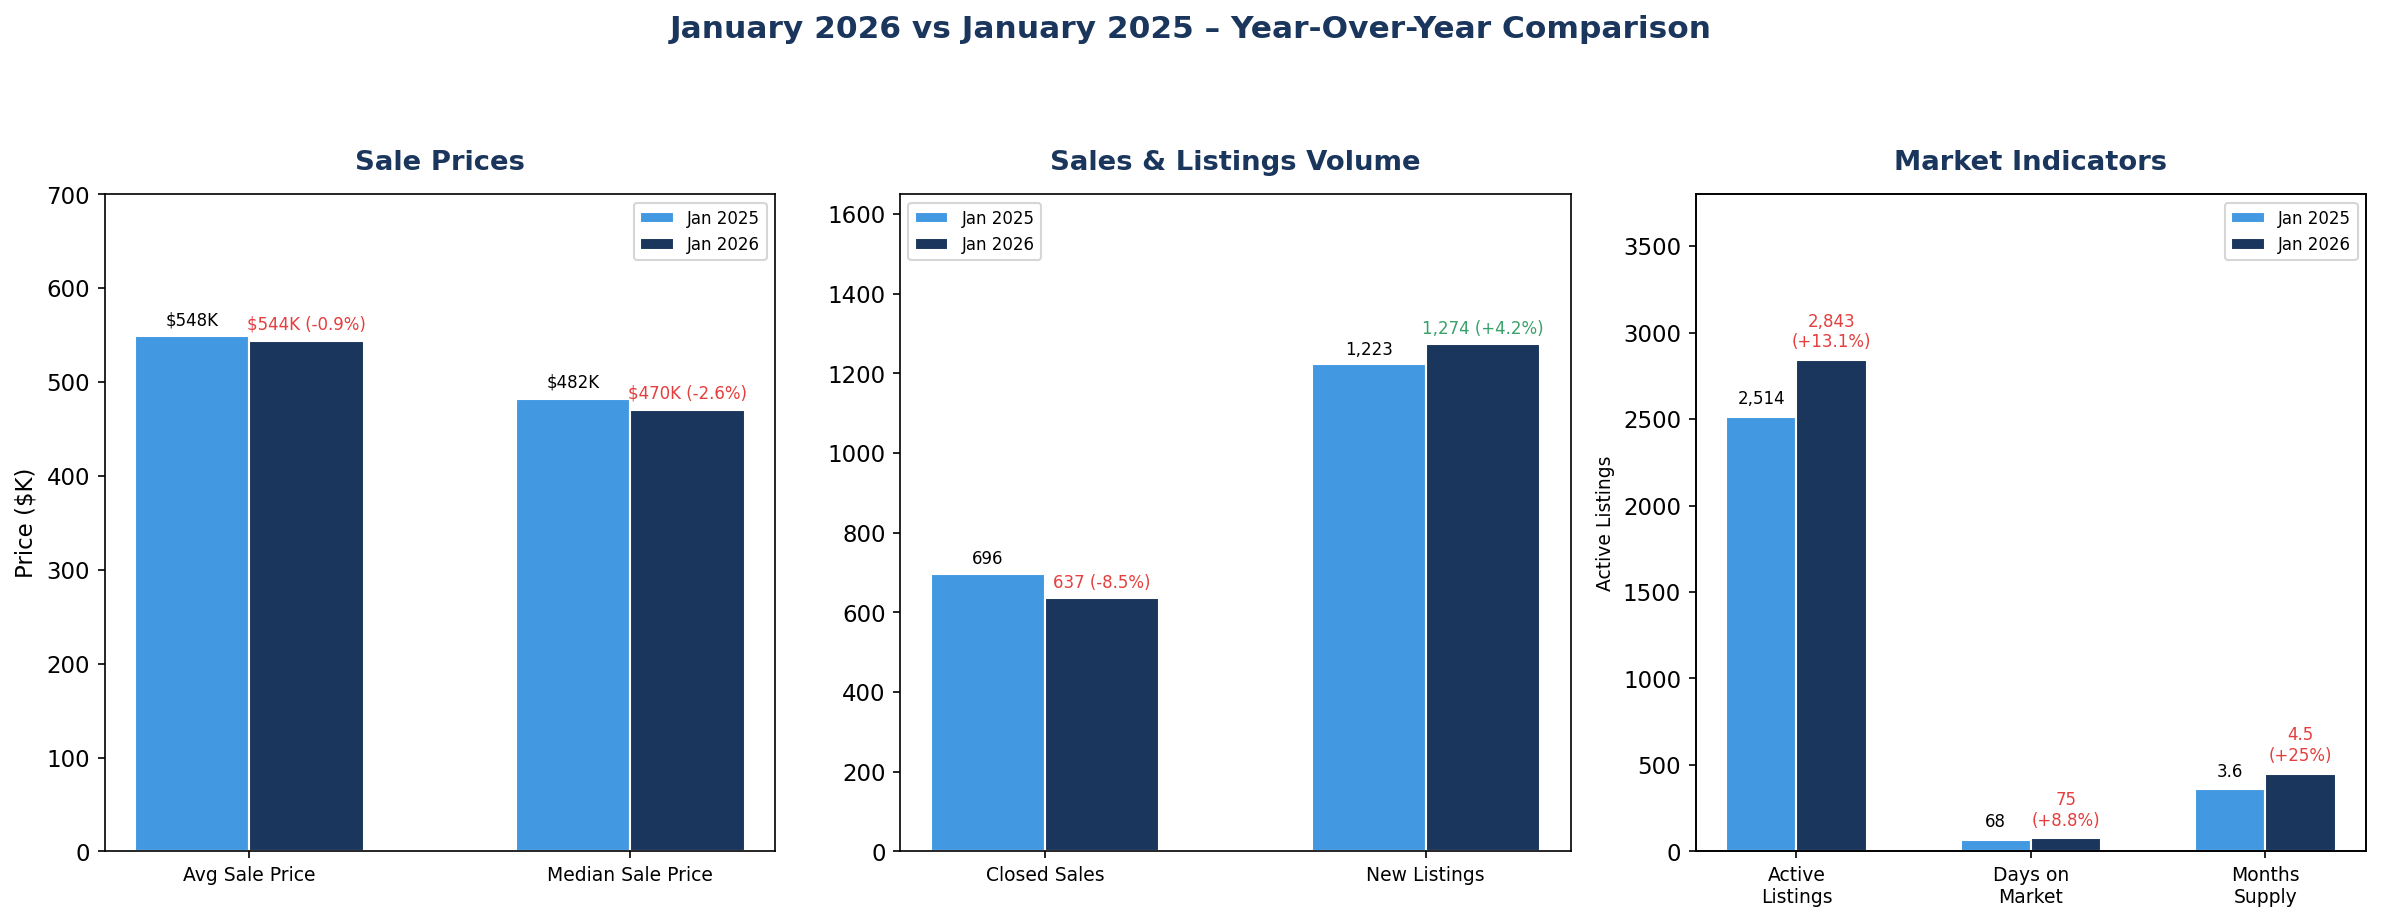
AVERAGE SALE PRICE
$543,847
▼ 0.9% YoY
|
MEDIAN SALE PRICE
$469,950
▼ 2.6% YoY
|
CLOSED SALES
637
▼ 8.5% YoY
|
DAYS ON MARKET
75
Avg Days
|
MONTHS SUPPLY
4.5
Buyer’s Market
|
Single Family & Patio Homes Market Analysis
Current Market Conditions: January 2026 continues to favor buyers in the Pikes Peak region. The median sale price of $469,950 is down 2.6% from last January, while active listings surged to 2,843 homes – the highest January inventory since 2013. With 4.5 months of supply (up 25% year-over-year) and homes taking an average of 75 days to sell, buyers have more choices and stronger negotiating power than they’ve had in years. Closed sales dropped 8.5% to 637 units, reflecting continued buyer caution amid elevated mortgage rates and economic uncertainty.
Year-Over-Year Market Changes
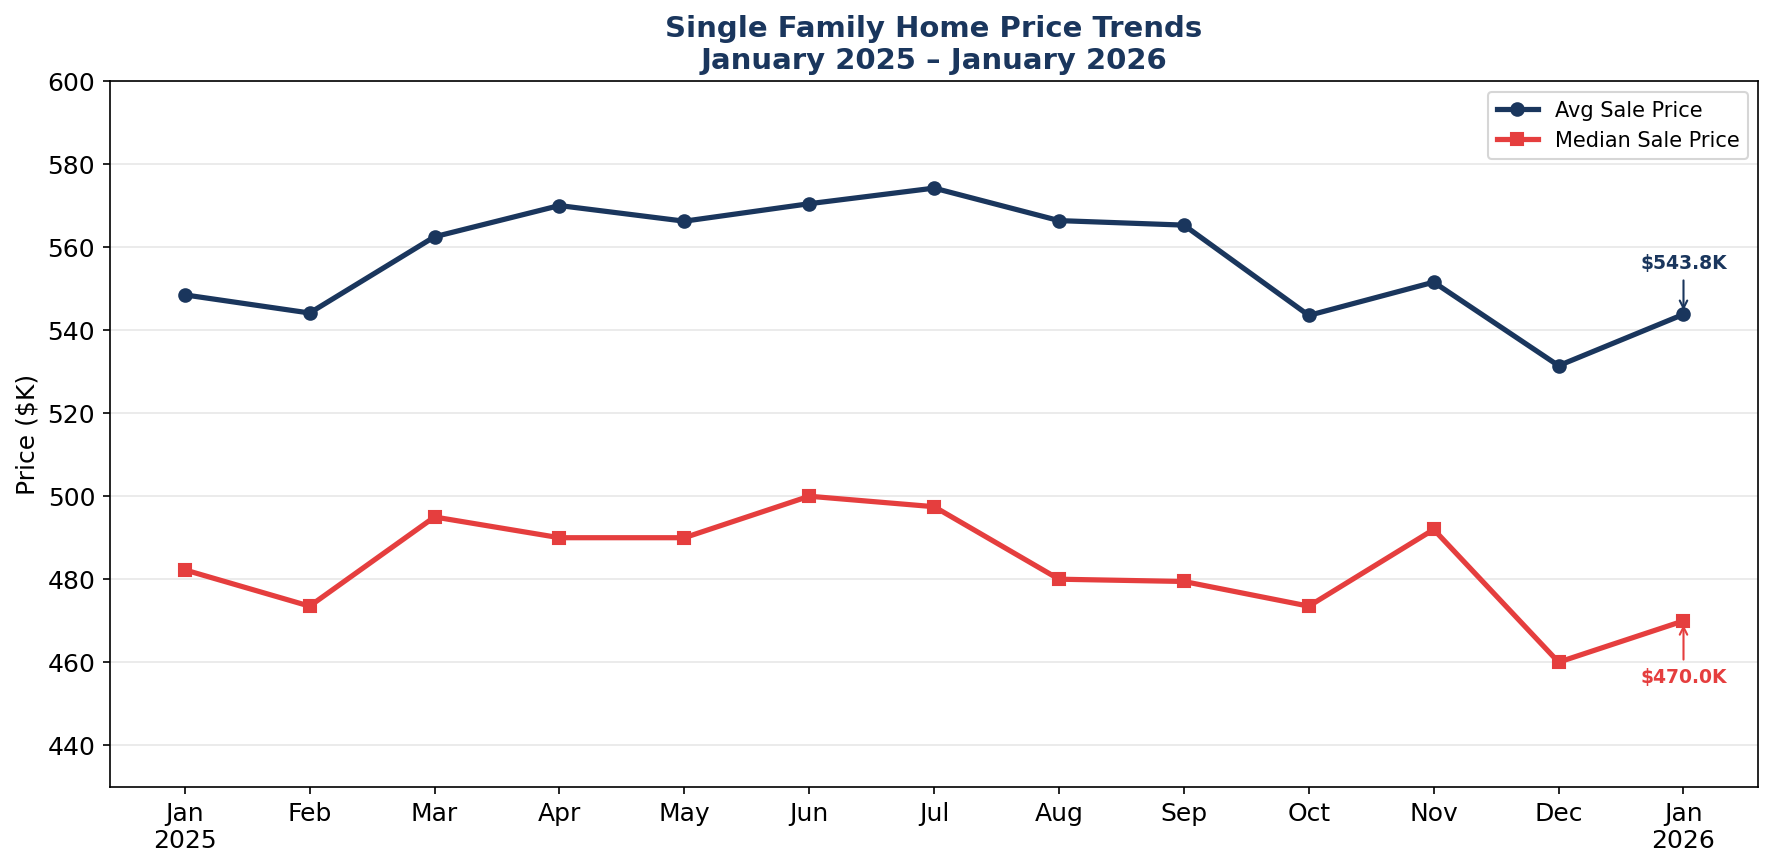
Price Trend Analysis
Homes For Sale – Inventory Trend
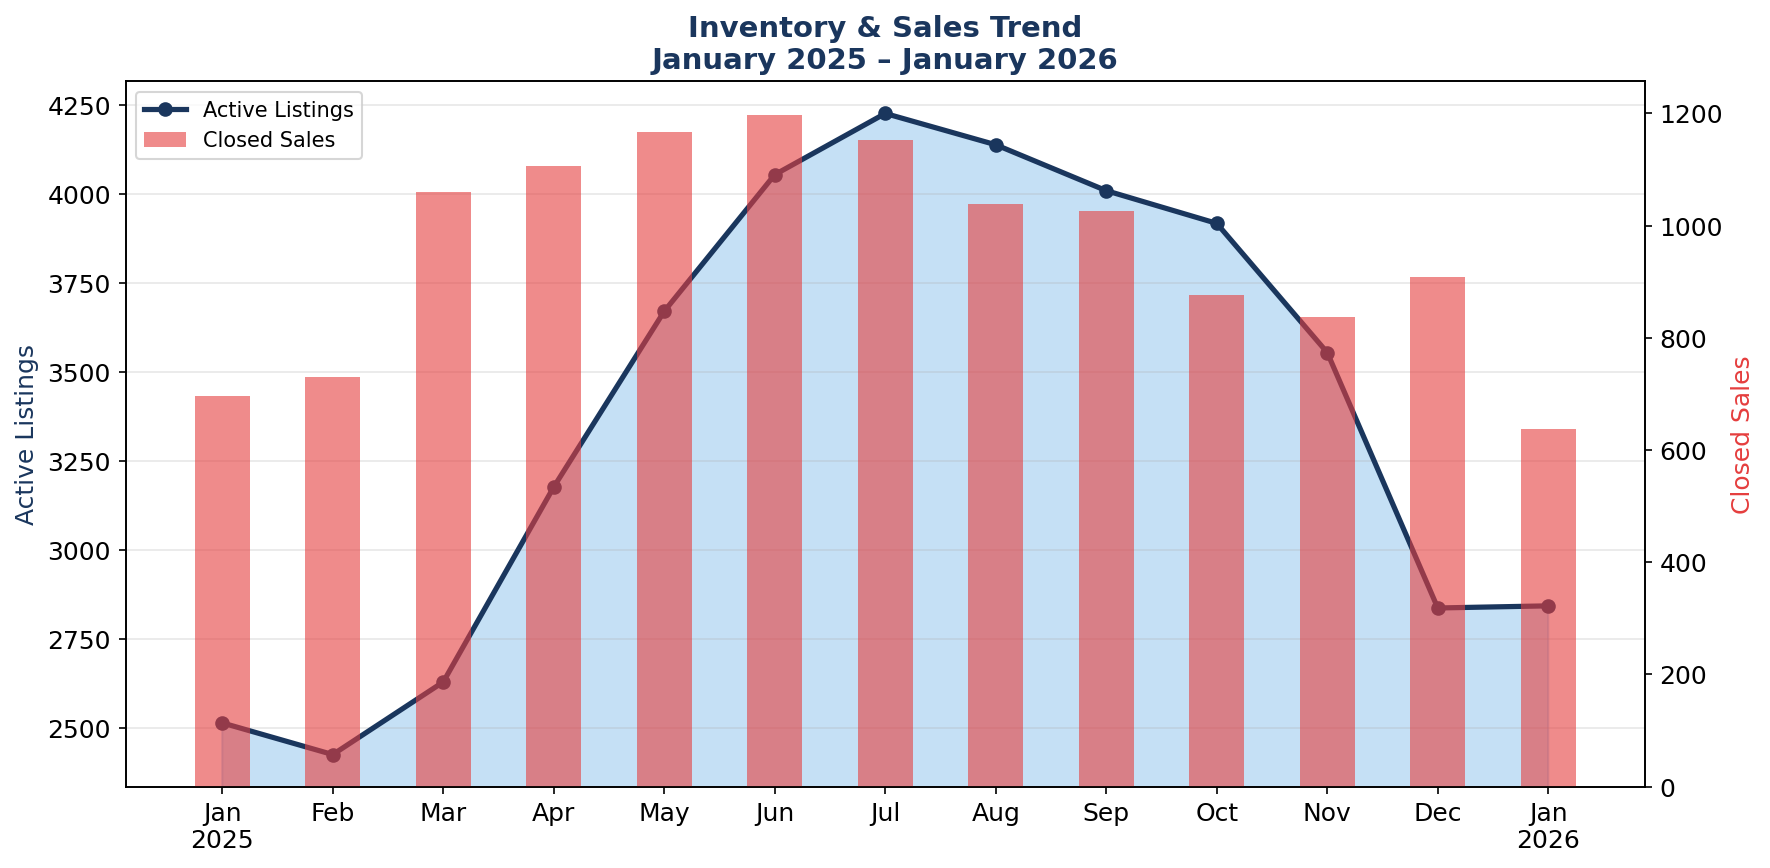
Inventory Insight: Active inventory sits at 2,843 homes – up 13.1% from January 2025’s 2,514 homes and the highest January level in over a decade. While inventory typically rises from winter lows into summer peaks (reaching 4,227 in July 2025), the elevated starting point for 2026 suggests even more inventory ahead this spring. Combined with only 637 closed sales (down 8.5%), this creates a 4.5-month supply – firmly in buyer’s market territory. Sellers need competitive pricing and strong presentation to attract offers.
Absorption Rate by Price Range
The absorption rate measures how quickly homes are selling. Rates above 20% indicate a seller’s market, while rates below 15% suggest a buyer’s market.
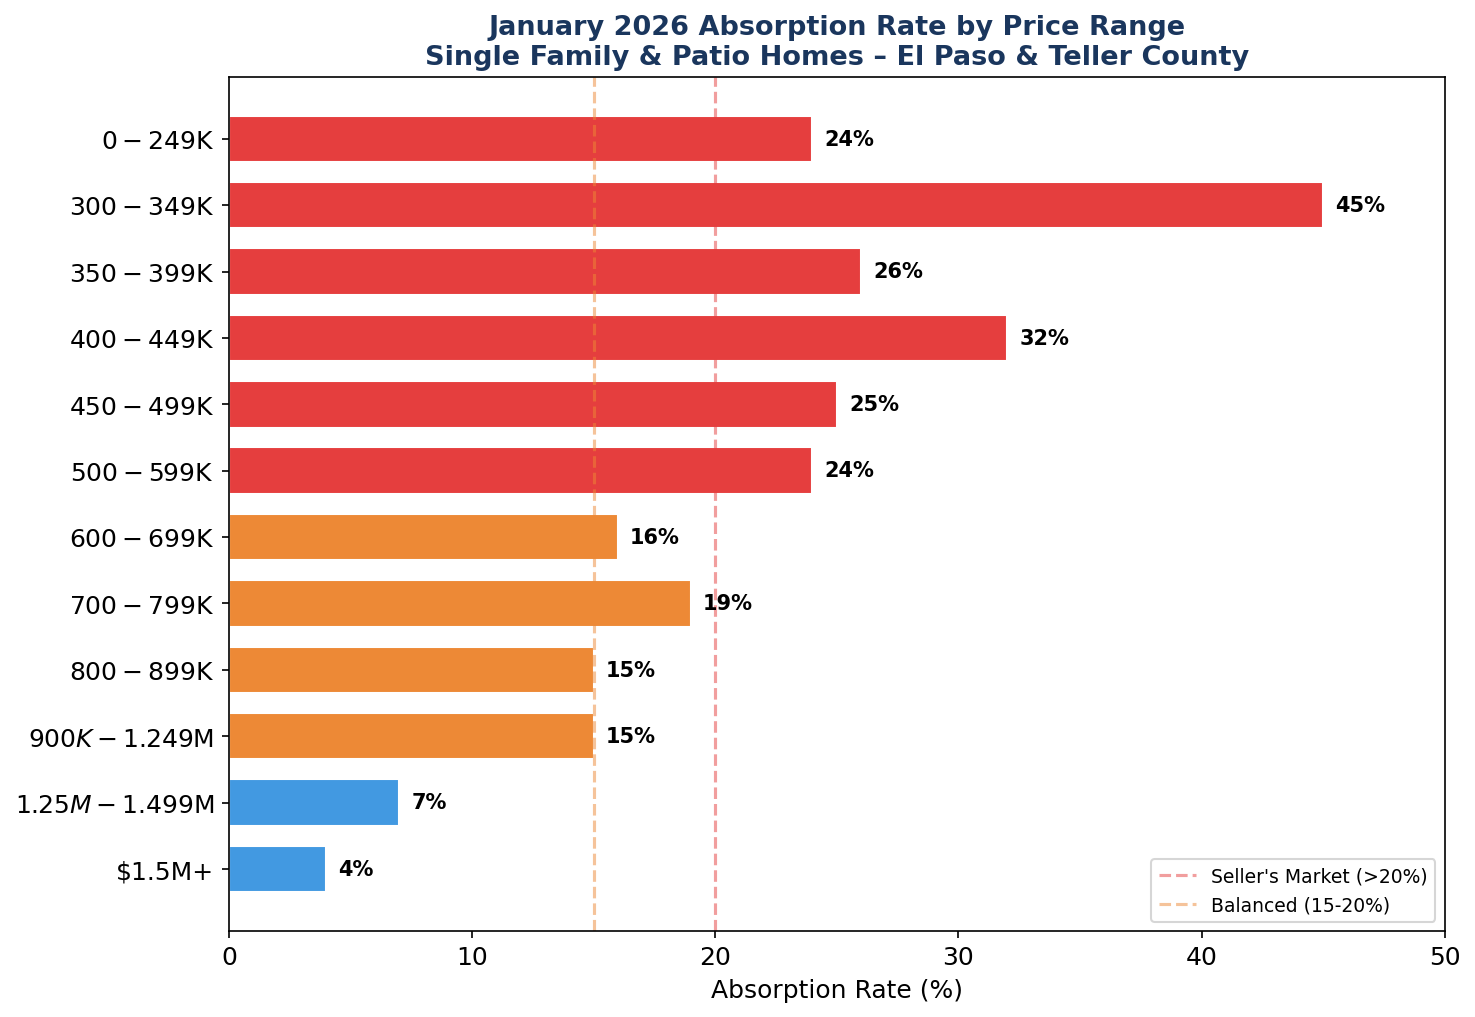
Price Range Analysis: The most competitive price range is $300K–$349K with a 45% absorption rate, followed by $400K–$449K at 32%. The $350–$400K and $500–$600K ranges show balanced conditions around 24–26%. Above $700K, absorption drops to 15–19%, and the luxury market ($1.25M+) strongly favors buyers with only 4–7% absorption rates. Buyers in higher price brackets have exceptional leverage to negotiate.
Days Supply by Price Range – Single Family Homes
Days supply indicates how long it would take to sell all current inventory at the current sales pace. Lower numbers indicate faster-moving markets.
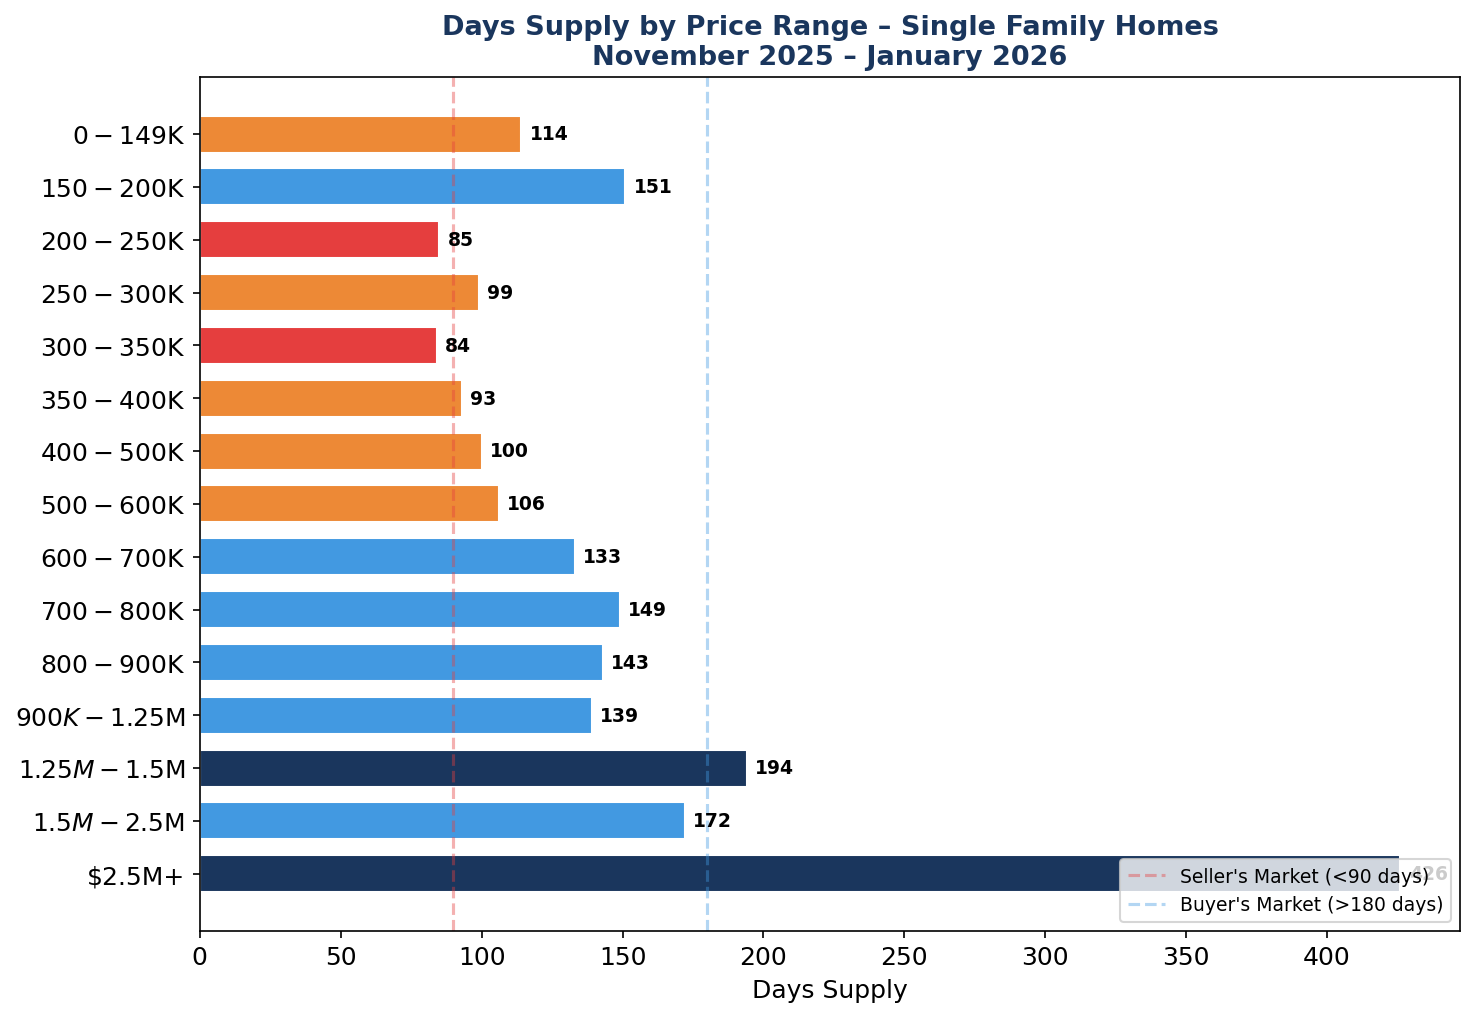
Inventory Analysis: The most active segments are $200–$250K (85 days supply), $300–$350K (84 days), and $350–$400K (93 days) – all indicating relatively balanced conditions. Mid-range homes from $400–$600K show 100–106 days of supply. Properties above $700K carry 133–194 days of inventory, while the ultra-luxury market ($2.5M+) has 426 days of supply, representing significant buyer opportunity at the high end.
Price Negotiations – January 2026
In January 2026, approximately 77% of homes sold below asking price, while 10% sold above asking, and 13% sold at list price. Overall, buyers are successfully negotiating prices down across most segments.
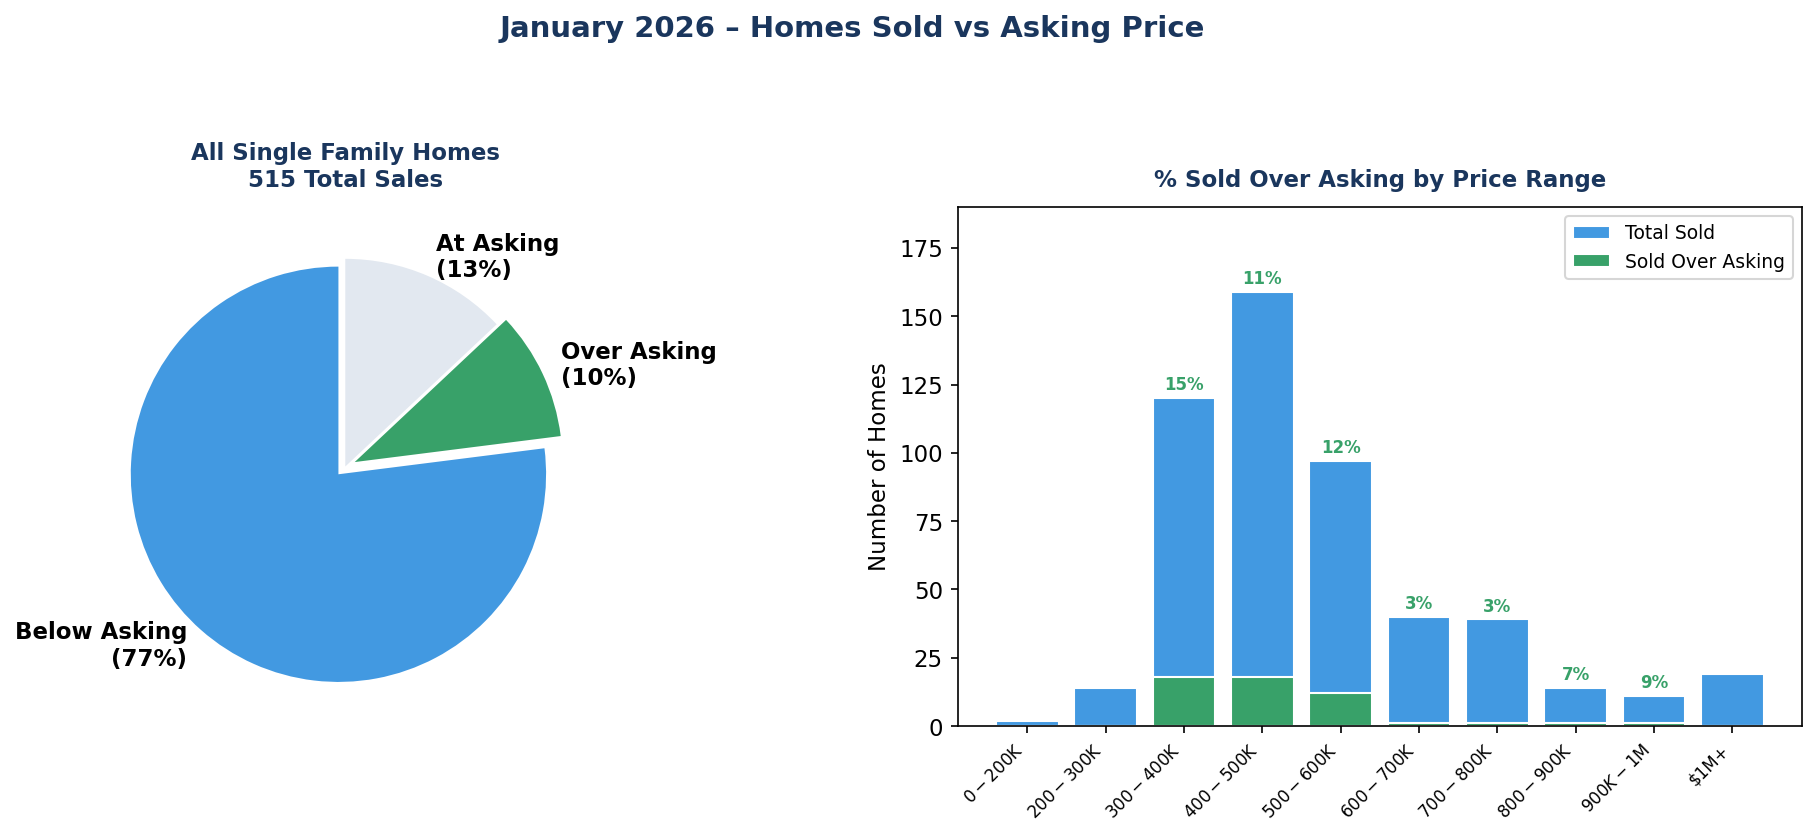
Homes Sold Over Asking Price by Price Range
| Price Range | Total Sold | Sold Over Asking | % Over Asking |
|---|---|---|---|
| $0 – $200K | 2 | 0 | 0% |
| $200K – $300K | 14 | 0 | 0% |
| $300K – $400K | 120 | 18 | 15% |
| $400K – $500K | 159 | 18 | 11% |
| $500K – $600K | 97 | 12 | 12% |
| $600K – $700K | 40 | 1 | 3% |
| $700K – $800K | 39 | 1 | 3% |
| $800K – $900K | 14 | 1 | 7% |
| $900K – $1M | 11 | 1 | 9% |
| $1M and Up | 19 | 0 | 0% |
| All Homes Sold | 515 | 52 | 10% |
Negotiation Tip: With 77% of homes selling below asking price and only 10% going above list, buyers continue to hold strong negotiating power in January 2026. The $300K–$500K range sees the most competition with 11–15% selling over asking. Sellers should price competitively from the start – the data shows overpricing leads to longer days on market and price reductions, with 30–40% of active listings in the $300K–$500K range having already reduced their price.
Days Supply by School District
| School District | Active | Sold | Days Supply | Avg Sold Price | Avg CDOM |
|---|---|---|---|---|---|
| Colorado Springs D11 | 372 | 459 | 75 | $474,282 | 62 |
| Harrison D2 | 106 | 134 | 73 | $369,463 | 61 |
| Falcon D49 | 475 | 406 | 108 | $505,801 | 82 |
| Academy D20 | 397 | 308 | 119 | $684,384 | 73 |
| Widefield D3 | 248 | 222 | 103 | $413,560 | 71 |
| Cheyenne Mountain D12 | 66 | 52 | 117 | $896,798 | 57 |
| Lewis-Palmer D38 | 199 | 139 | 132 | $831,859 | 99 |
| Manitou Springs D14 | 33 | 25 | 121 | $685,510 | 76 |
| Fountain D8 | 90 | 60 | 138 | $446,959 | 58 |
| Woodland Park RE2 | 129 | 98 | 121 | $578,918 | 88 |
| Cripple Creek/Victor RE1 | 63 | 33 | 176 | $441,736 | 140 |
School District Highlights: Colorado Springs D11 and Harrison D2 have the fastest-moving markets with just 73–75 days of supply, driven by their lower average price points ($369K–$474K). Academy D20, despite being the most active district by listing count (397 active), has 119 days of supply due to higher price points averaging $684K. Cheyenne Mountain D12 commands the highest average sold price at $896,798 but has 117 days of supply. The outlier is Cripple Creek/Victor with 176 days of supply and 140 average cumulative days on market.
Condos & Townhomes Market
|
MEDIAN PRICE
$300,000
▼ 11.8% YoY
|
AVERAGE PRICE
$332,289
▼ 10.1% YoY
|
CLOSED SALES
69
▼ 20.7% YoY
|
DAYS ON MARKET
95
Avg Days
|
MONTHS SUPPLY
7.8
Buyer’s Market
|
Condo Market Highlights: The condo and townhome market has shifted significantly in favor of buyers. At 7.8 months of supply (up 34.5% from 5.8 last January), this segment is firmly in buyer’s market territory. Closed sales dropped 20.7% to just 69 units, and median prices fell 11.8% to $300,000. Days on market climbed to 95 days – up nearly 38% from last year’s 69 days. With 535 active listings and sluggish demand, condo buyers have strong leverage to negotiate favorable terms. The average condo closed sold price across all areas was $379,351 with 95 average CDOM.
Rental Market Snapshot
The Pikes Peak MLS shows 217 active rental listings in January 2026 with a median asking rent of $2,100/month. El Paso County accounts for 207 of those listings at a median of $2,100, while Teller County has 6 listings at a median of $1,425. Rental demand remains steady with 108 new rental listings added during the month.
Market Outlook – Early 2026
Key Takeaways for Buyers: January 2026 offers one of the most buyer-friendly environments in over a decade. Record-high January inventory (2,843 homes), declining prices, and 77% of homes selling below asking create excellent conditions. The $300K–$500K range remains the sweet spot with the most activity, though competition is moderate. Buyers should take advantage of seller willingness to negotiate – price reductions are common across all price ranges, with 30–40% of listings in the core $300K–$500K range having reduced prices.
Key Takeaways for Sellers: Pricing strategy is critical. With 4.5 months of supply and homes taking 75 days to sell on average, overpricing will result in extended time on market and eventual reductions. The data shows sharp pricing from day one generates the best results. Homes in the $300K–$450K range still move within balanced-to-seller conditions if priced right. Above $600K, prepare for longer marketing periods and buyer negotiations.
Data Source: Pikes Peak REALTOR Services Corp. (RSC) | January 2026
Market data for residential properties in El Paso County and Teller County, Colorado.
*Information gathered from the Pikes Peak MLS is deemed reliable but not guaranteed.